Most restaurant owners can tell you last night's sales. Fewer can tell you last week's prime cost, Tuesday's RevPASH, or whether labor as a percent of sales drifted before the month closed. That gap is expensive. KPIs are not spreadsheets for accountants; they are the early warning lights that tell you to fix scheduling before payroll, cut a prep list before food cost spikes, or add a server before ticket times blow up reviews. A connected restaurant POS is where those numbers should start, because if sales and labor live in one system and food cost lives in another, you are always reconciling instead of deciding.
This guide is the short list, not the encyclopedia. We cover the restaurant metrics that actually change behavior for independents and small groups: what to track daily, weekly, and monthly, how to calculate the ones that confuse people (RevPASH, prime cost, sales per labor hour), benchmark ranges by concept, and how to run a thirty-minute weekly review without building a data team. You already have deep dives on food cost and labor; this article is the map that tells you when to open them. Pair operational KPIs with your restaurant accounting rhythm so the floor and the books tell the same story.
KPIs vs data noise
Your POS can export a hundred columns. That does not mean you need a hundred KPIs. Data becomes useful when someone owns a number and a threshold. "Labor feels high" is a feeling. "Dinner labor hit 34 percent on 4,800 dollars of sales three Tuesdays in a row while covers were flat" is a KPI conversation that ends in a schedule edit or a marketing push.
Pick ten to fifteen metrics maximum for your weekly dashboard. Put the rest in a monthly archive you pull only when diagnosing a problem. The operators who win treat KPIs like a blood panel: small set, regular cadence, action when something is out of range.
The weekly rhythm that works
Daily (five minutes): gross sales, covers or tickets, labor hours clocked so far, any 86 that affects tomorrow's prep. Glance during service or at close.
Weekly (thirty minutes, same morning): prime cost components, food cost percent, labor percent, average check, RevPASH or turns, voids and comps, top and bottom menu items. Compare to last week and to the same week last year if you have the data.
Monthly: full P&L, cash balance trend, inventory variance, guest review themes, retention proxies from loyalty or repeat orders. Our restaurant P&L guide covers the monthly close; this article feeds it.
Financial KPIs
Prime cost percentage
Prime cost is COGS plus total labor, divided by revenue. It is the master KPI because food and labor are the two levers you pull every day. Target bands: full-service often 60 to 65 percent, fast-casual 55 to 60 percent, QSR lower still. If prime cost is over target while sales look healthy, you are subsidizing guests. Fix portions, schedule, or menu mix before you blame the economy. Deep dive: restaurant prime cost.
Food cost percentage
Food purchases (or usage) divided by food sales. Full-service often lands 28 to 35 percent depending on protein mix and beverage split. Track weekly with a simple inventory rhythm, not just monthly when the vendor statement arrives. Spikes often trace to waste, theft, unrecorded comps, or a vendor price you never updated in recipes. See food cost percentage.
Labor cost percentage
Total labor divided by revenue, by daypart if possible. Dinner labor above 30 to 32 percent on the same sales volume week over week is a scheduling problem, not a morale speech. Compare sales per labor hour: if it drops while hours stay flat, you are overstaffed or under-selling. See restaurant labor cost.
Gross and net profit margin
Gross margin is revenue minus COGS. Net margin is what remains after all expenses. Independent full-service net margins often sit in the low single digits to high single digits when run well. Net margin without prime cost discipline is a lagging scorecard that tells you the month already happened.
Cash runway
How many days of operations your cash balance covers at current burn. Restaurants fail on cash timing more often than on paper profit. Track weekly when tight; monthly when stable. Pair with payment settlement timing so you know when card batches actually hit the bank.

Operational KPIs
RevPASH (revenue per available seat hour)
Formula: total revenue divided by (seats times hours open). A 60-seat room open 6 hours at 3,600 dollars revenue: RevPASH equals 10 dollars per seat hour. Compare lunch versus dinner, weekday versus weekend. Rising RevPASH with flat seats means higher checks or faster turns. Falling RevPASH with busy-looking dining room means you are seating poorly or leaving tables camped. Related: restaurant table turnover.
Table turn rate
Covers divided by seats for a service period, or turns per table in a section. Full-service dinner often targets 1.5 to 2.5 turns depending on concept. One extra turn on a busy night is pure incremental revenue on fixed rent.
Average check (average ticket)
Revenue divided by covers or transactions. Track with and without alcohol if you run a bar-heavy room. A falling average check with steady covers is a menu mix or upsell problem. A rising check with falling covers may mean you priced out lunch.
Ticket time and speed of service
Time from order fired to food delivered, or total table time from seat to pay. POS and kitchen display timestamps make this measurable. Spikes cluster by station, server, or daypart. Fix the cluster, not the whole building.
Covers and transactions
Raw volume still matters. A great prime cost on collapsing covers is a shrinking business. Track year-over-year for the same day of week to remove seasonality noise.
Labor and productivity KPIs
Sales per labor hour: revenue divided by total labor hours in the same period. Drop this number while hours hold steady and you are paying people to wait.
Overtime hours and percent of total hours: overtime is a schedule design failure visible in dollars.
Schedule variance: planned hours versus actual clocked hours. Chronic variance means your forecast is wrong or managers are editing on the fly without updating the plan.
Tie labor KPIs to staff scheduling discipline, not gut feel.
Inventory and waste KPIs
Theoretical vs actual usage: what recipes say you should have used versus what inventory shows. Variance is waste, theft, or portion drift.
Inventory turnover: how fast stock moves. Slow turnover ties up cash and increases spoilage risk.
Waste and spoilage log: even a simple daily log of what hit the trash makes patterns visible. Connect to stock management when you are ready to automate counts.
Guest and marketing KPIs
Review volume and average rating trend: velocity matters as much as stars in local search.
Repeat visit rate: from loyalty or matched card data. Members visiting twice a month beat one-time tourists.
Direct order share: percent of off-premise revenue through your own ordering versus third-party apps. Rising direct share protects margin.
Reservation no-show rate: for reservation-heavy concepts, no-shows are lost inventory.
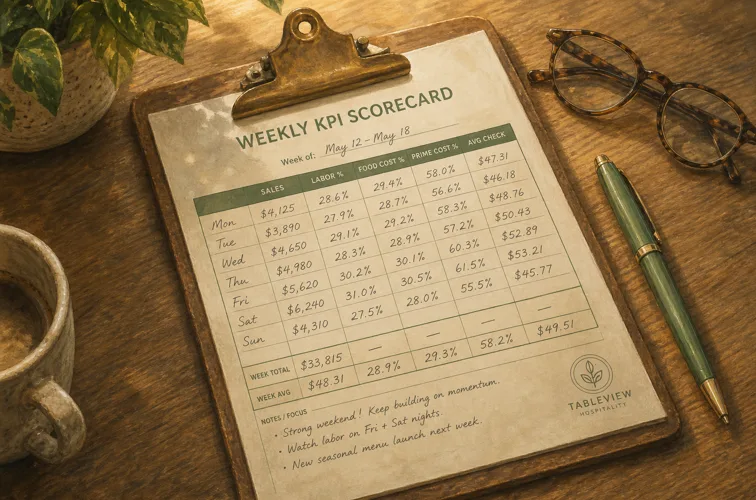
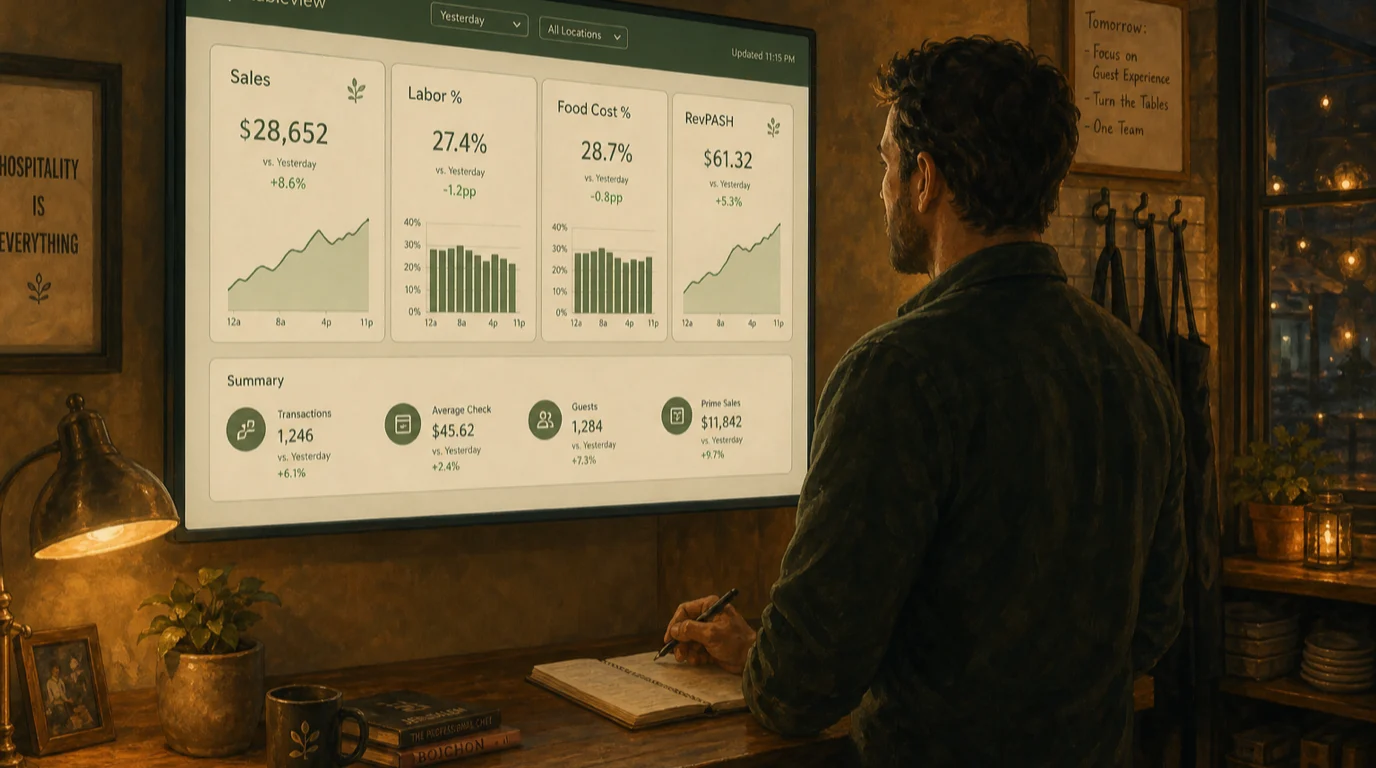
Building a one-page weekly dashboard
One screen or one printed page. Columns: metric, this week, last week, same week last year, target, notes. Rows: sales, covers, average check, food cost percent, labor percent, prime cost, RevPASH or turns, voids and comps dollars, top three sellers, bottom three sellers.
Assign an owner. The GM prepares it; the owner reviews it; one action item leaves the meeting. "Labor high" is not an action. "Cut one closer on Mon/Tue until covers recover" is.
Benchmarks by concept (starting points, not laws)
Full-service dinner: prime cost 60 to 65 percent, food cost 30 to 35 percent, dinner labor 28 to 32 percent, RevPASH varies widely by check size.
Fast-casual: prime cost 55 to 60 percent, food cost 28 to 32 percent, labor 25 to 30 percent, focus on throughput and average ticket.
Bar-forward: pour cost and beverage mix KPIs join food cost; labor may run higher on late night with lower food sales.
Your market and menu beat industry averages. Track your own trend lines first, benchmarks second.
Common KPI mistakes
Tracking monthly only. By the time food cost shows up in a monthly report, you spent the cash three weeks ago.
Chasing vanity covers. Packed dining room with 40 percent prime cost is not success.
Different definitions. If food cost means purchases in accounting but usage on the floor, the team argues over numbers instead of fixing portions.
No link to action. Dashboards that nobody changes behavior for become wallpaper.
Ignoring dayparts. Blended labor percent hides a lunch disaster compensated by dinner.
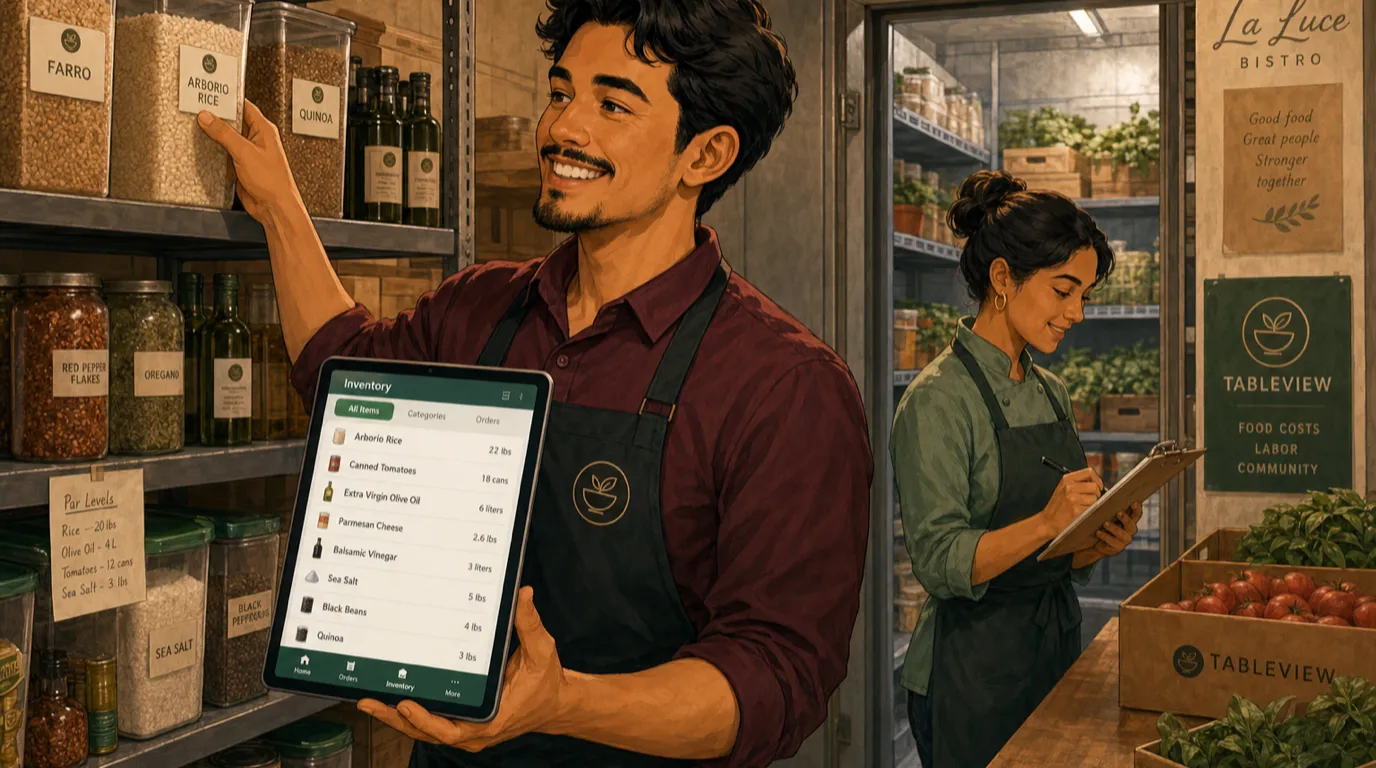
Tools: connect POS, inventory, and accounting
KPIs break when systems disagree. Sales and labor should flow from the POS daily. Food cost needs purchasing and inventory aligned weekly. The P&L in accounting should use the same category definitions the manager sees on the floor. Middleware and exports are fine at small scale; integrated stacks scale cleaner.
Start where you are. Even a weekly export into a spreadsheet beats flying blind. Automate when the manual version has run reliably for two months and everyone trusts the definitions.
Your first ninety days with KPIs
Days 1 to 14: Pick eight metrics. Write definitions on one page. Pull four weeks of history from POS.
Days 15 to 45: Weekly meeting every Monday. One action per week. No new metrics until attendance is consistent.
Days 46 to 90: Add inventory variance or RevPASH if missing. Compare to last year. Tie one marketing or scheduling experiment to a KPI you chose in advance.
After ninety days you should feel problems in the week they start, not in the month they end. That is the whole point of restaurant KPIs: fewer surprises, faster fixes, and a floor that runs on numbers you trust.
Worked examples: math you can run on a napkin
Abstract formulas fail on the floor. Concrete numbers stick.
Prime cost: Last week you did 52,000 dollars in sales. Food usage at cost was 16,900. Total labor was 15,600. Prime cost equals (16,900 + 15,600) / 52,000 = 62.5 percent. In band for full-service, but labor was 30 percent alone, so you still have a Tuesday scheduling question even if the blended number looks fine.
RevPASH: Saturday dinner: 48 seats, 5 hours, 7,200 dollars revenue. RevPASH = 7,200 / (48 x 5) = 30 dollars per seat hour. Last Saturday same seats and hours at 6,000 dollars was 25 dollars RevPASH. You picked up speed or check size; item mix report tells you which.
Sales per labor hour: Lunch shift: 2,400 dollars sales, 28 labor hours. SPLH = 85.71 dollars. Last month same shift averaged 95 dollars SPLH with 26 hours. You added hours without adding sales. Cut one body or push a lunch promo before next week.
Average check: 180 covers, 8,100 dollars food and beverage revenue. Average check = 45 dollars. Wine attach rate fell from 22 percent to 14 percent; that is a training or suggestive sell issue, not a traffic issue.
Digital and channel KPIs
Off-premise is no longer a side channel. Track it like dining room revenue.
Third-party delivery mix: percent of delivery sales through apps versus direct. Every point shifted to direct is margin recovered if commission is 25 to 30 percent.
Online order average versus in-store: delivery baskets often differ; price and pack for margin accordingly.
Mobile order completion rate: carts abandoned on your ordering flow signal menu friction or payment errors.
Kiosk or QR order share: if you run self-order, track average check and labor hours together so you know whether kiosk is lifting ticket or only cutting labor.
Multi-location KPIs (when one screen is not enough)
Groups need the same definitions at every site, then compare locations fairly.
Roll up prime cost, labor percent, and average check by store weekly. Rank stores by RevPASH or SPLH, not just raw sales, so a high-rent flagship is not unfairly compared to a small suburban box. Flag stores whose metrics diverge from their own trailing twelve-week average, not only from the group average. A location drifting from its own history is the early warning; benchmarking against the best store in the group comes second.
Shared category mapping in the POS matters. If one manager codes comps differently, group food cost lies. Standardize void and comp reasons across stores before you trust a rollup dashboard.
A KPI dictionary for your team
Post definitions in the office so managers use the same words.
COGS: cost of goods sold for the period, usually from inventory change plus purchases.
Cover: one guest served; definitions vary for split checks, count consistently.
Comp: complimentary item or discount given by the house; track dollars, not just count.
Void: item removed before service; high void rate may mean training or theft.
Daypart: lunch, dinner, late night; always segment labor and sales by daypart when diagnosing.
Same-store sales: revenue at locations open more than twelve months, excludes new units.
When everyone defines terms the same way, the weekly meeting argues about fixes, not vocabulary.
When a KPI moves, what to do first
Food cost up, sales flat: walk inventory, check portion photos, verify vendor invoices against recipe cards, read waste log.
Labor up, sales flat: audit schedule against forecast, check overtime, look at SPLH by daypart.
RevPASH down, covers up: campers, slow kitchen, or bad seating chart; watch table times.
Average check down, covers flat: menu mix shifted to low sellers, weak upsell, or discount stack.
Reviews down, operations KPIs fine: hospitality and communication issue, not necessarily food; read recent one-star text for patterns.
One lever at a time. Change the schedule or the prep list or the promo, not all three, so you know what worked.
Guest experience KPIs that predict revenue
Operations metrics tell you whether the machine runs. Guest metrics tell you whether people come back.
Net Promoter Score or simple post-visit survey: even a one-question text after a reservation or online order builds a trend line. Detractors who mention wait time tie directly to staffing KPIs.
Complaint rate per thousand covers: track category: food, service, wait, billing. A spike in billing complaints after a POS change is a training signal, not a kitchen signal.
Repeat rate within 30 days: loyalty programs make this measurable; without loyalty, proxy with matched emails or reservation history.
Table time versus guest satisfaction: longer table time is good for revenue until it hurts satisfaction. Plot average table minutes against review mentions of "slow" to find your concept's ceiling.
Connecting KPIs to break-even and profit
KPIs are most powerful when tied to the number of covers or dollars you need to survive. Fixed costs do not care how busy you felt. If break-even is 420 covers at a 38 dollar average check and you are running 380 on weekdays, marketing and scheduling KPIs should target that gap explicitly. Our break-even analysis guide builds the target; weekly KPI review measures progress toward it.
Contribution margin per cover (average check minus variable food and labor cost per cover) tells you how many more covers you need to pay the rent increase. That single derived KPI often settles arguments about whether to extend hours or close Monday.
Inventory KPIs in practice
Run a weekly spot check on your top ten items by dollar usage. If theoretical salmon usage was 40 pounds from sales and inventory shows 48 pounds gone, eight pounds need an explanation before you accept a food cost spike as normal.
Count frequency by category: high-value proteins weekly, dry goods monthly, liquor daily or weekly by state rules. The KPI is not the count itself; it is variance trend. Three weeks of rising variance on the same item is a portioning or receiving problem, not bad luck.
What good POS reporting should give you without a export
At minimum, your system should show sales by daypart, labor hours integrated or importable, item-level mix, void and comp reporting, and payment mix. Same-day visibility beats next-morning email attachments. Managers who wait for the accountant's package to learn yesterday's labor percent are flying blind on the shift that already happened.
Advanced layers add table times from reservations, kitchen ticket timestamps from a kitchen display, and cohort reporting from loyalty. Add complexity only when the weekly eight-metric dashboard is boring and trusted.
Seasonality and weather: read KPIs in context
A snow day crushes covers but may not mean your team forgot how to sell. Compare to the same weather last year when possible, or to the trailing four-week Tuesday average, before you rewrite the schedule. Patio season flips RevPASH and labor needs; set separate targets for patio-open weeks versus indoor-only weeks so managers are not punished for rain.
Holiday weeks distort everything. Build a simple calendar note in your dashboard: "Mother's Day, expect plus 40 percent covers, plus 3 labor points." After the event, score forecast accuracy so next year's plan improves. KPIs without context create false alarms; context without KPIs creates excuses. You need both.
Who should see which KPIs
Not every number belongs on the wall in the kitchen. Line cooks need ticket times and 86 accuracy, not company-wide labor percent. Servers benefit from average check by section and table turn goals, not vendor invoice detail. GMs need the full weekly dashboard. Owners need weekly plus cash and monthly P&L. Share the metric that lets each role act the same day, and keep sensitive margin targets in manager meetings until the team understands how their behavior moves the numbers they do see.
Transparency builds trust when paired with training. Posting labor percent without explaining how sidework and scheduling interact just creates anxiety. Show the team one KPI they control, celebrate when it moves, and connect it to hours and tips when you can.
Read next: Restaurant prime cost, Restaurant labor cost, and Restaurant break-even analysis.