
Most restaurant owners can recite their sales for last week off the top of their head. Ask them their gross margin, prime cost, or EBITDA for the same period and the answer usually arrives weeks late, from a bookkeeper, in a spreadsheet nobody opens until tax season. That gap is where independent restaurants lose money quietly. The fix is not a better bookkeeper. It is a P&L statement that lives on the operator's desk and gets read weekly, not quarterly.
A restaurant profit and loss statement is the single most useful financial document an operator has. Done properly, it tells you in one page whether the kitchen is buying well, whether the team is the right size, whether the rent is appropriate for the volume, and whether the business is actually paying anybody at the end of the month. Done poorly, it tells you nothing you can act on and arrives too late to matter. The difference between the two has almost nothing to do with accounting expertise. It has everything to do with structure, cadence, and the willingness to read the same nine lines every Monday morning for the next ten years.
This guide covers what a restaurant P&L actually contains, the line-by-line structure operators use, the formula and the healthy benchmarks by venue type, an interactive calculator you can run with your own numbers in a minute, the weekly rhythm that catches problems while they are still fixable, the six most common mistakes operators make, and the way a modern POS and accounting stack turns the whole exercise from a month-end project into a Monday-morning habit.
What is a restaurant P&L statement?
A profit and loss statement, often called an income statement, is the document that summarises what the business earned and what it spent over a defined period. For a restaurant the period is almost always a calendar month for accounting and reporting purposes, and a trading week for operational decision-making. Both cadences matter. The monthly P&L is what your accountant, your investors, and the tax authority will eventually see; the weekly P&L is what stops you from losing the month.
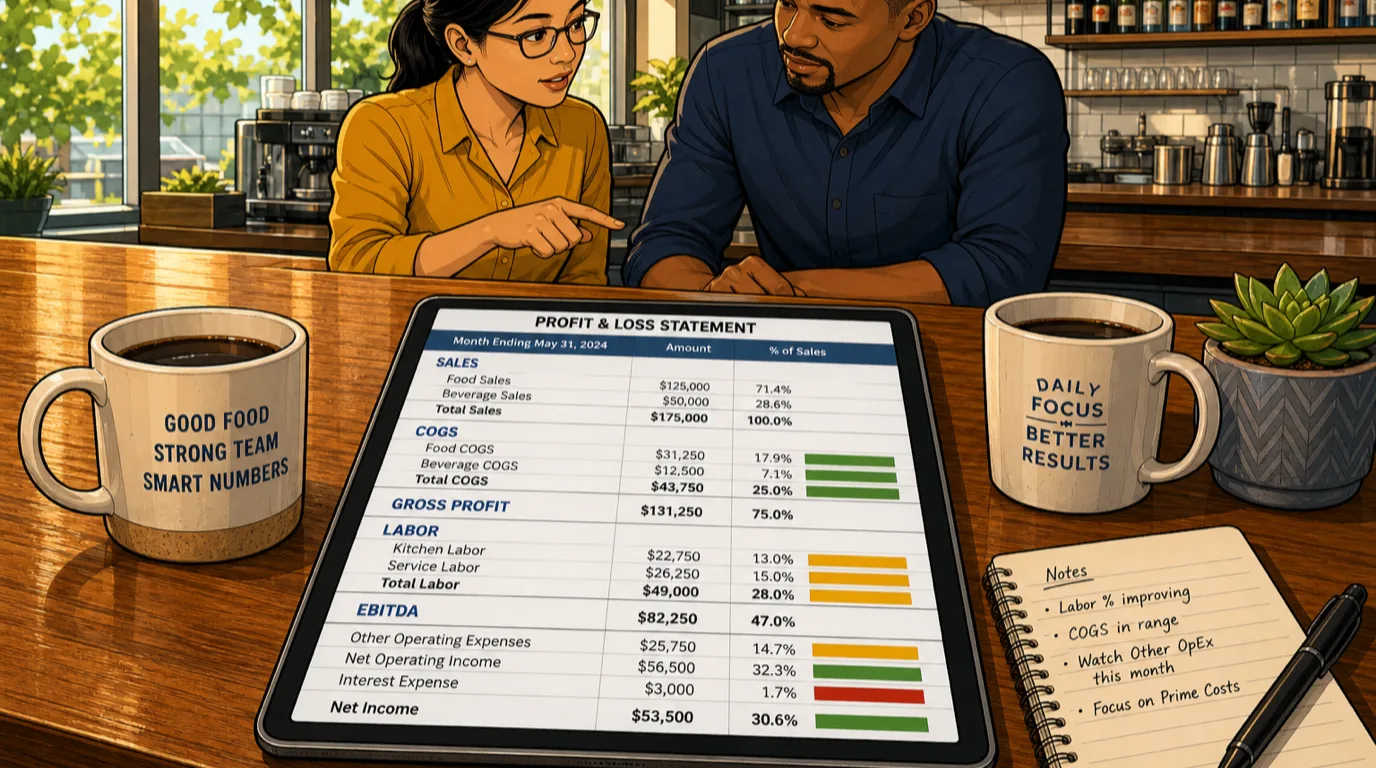
The structure is always the same regardless of venue. Sales sit at the top. Cost of goods sold (food and beverage) comes out first. What is left is gross profit. Labor, occupancy, and other operating expenses come out next. What is left is operating profit, usually expressed as EBITDA - earnings before interest, taxes, depreciation, and amortisation. Finally interest, taxes, and depreciation come out, leaving net profit at the bottom. The lines never move; only the numbers change.
That stability is exactly why the P&L is so useful as a diagnostic. Once you have read your own statement a dozen times, your eye learns where the trouble usually shows up. A two-point drift in food cost looks different from a two-point drift in labor cost, and both look different from a three-point drift in occupancy. The same nine lines, read every week for a year, will tell you more about how your restaurant actually runs than any single management book ever will.
The seven sections of a restaurant P&L
Every well-built restaurant P&L has seven sections. The order matters because each section answers a question that depends on the one above it being correct.
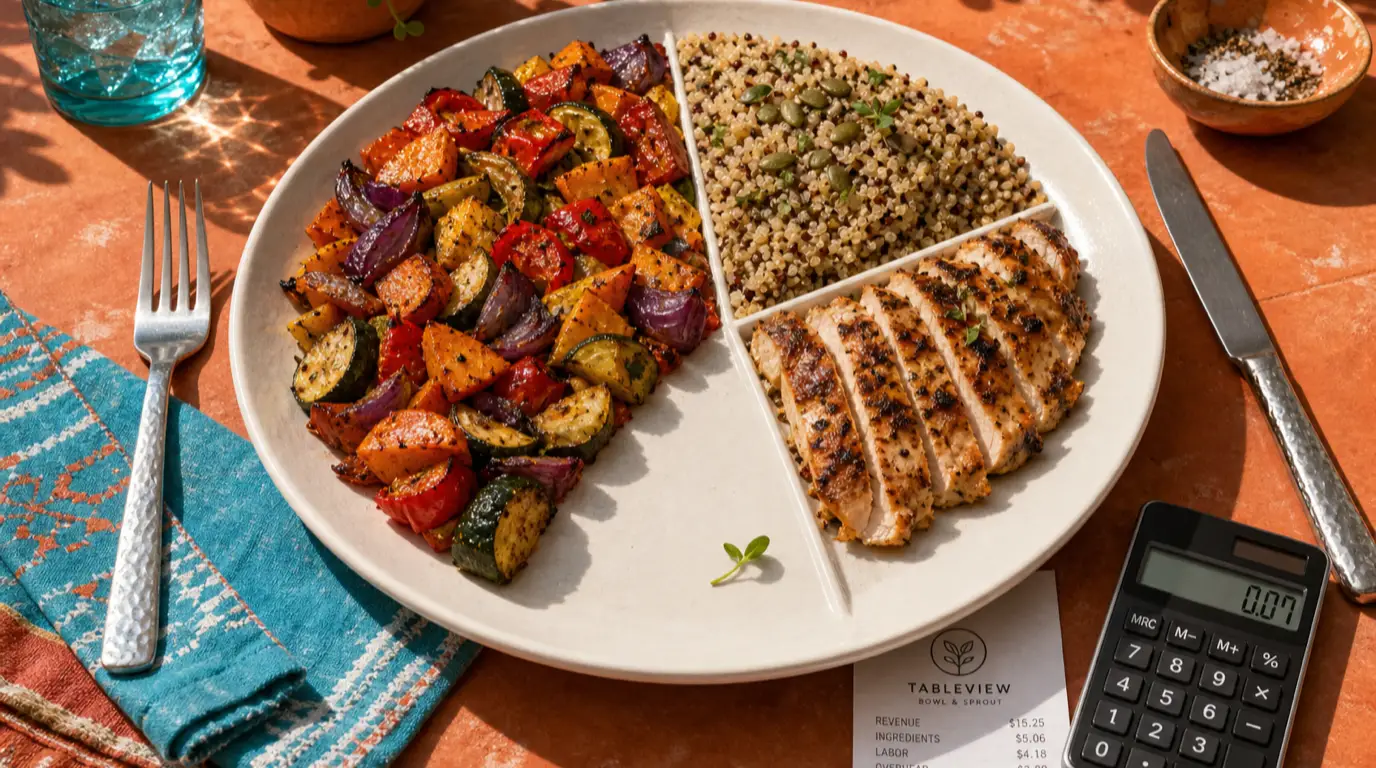
1. Sales / revenue. Split at minimum into food sales and beverage sales, with merchandise and gift cards on separate lines if you sell either. Every figure should be net of tax. Mixing beverage into food revenue is the single most common amateur mistake and it hides margin problems on both sides at once. Pair this with a clean distinction between service charges and tips so the revenue line shows only what the restaurant actually earns.
2. Cost of goods sold (COGS). Split into food COGS and beverage COGS, computed from inventory, never from invoices. The formula is starting inventory plus purchases minus ending inventory. Invoices tell you what arrived; only the physical count tells you what was actually used. A kitchen that books cost from invoices will look heroically profitable in any week deliveries are small and alarmingly unprofitable the week a freezer order lands.
3. Gross profit. Revenue minus COGS. This is the money left to pay for labor, occupancy, every other operating cost, debt service, and you. A casual restaurant should be running at a gross margin in the high sixties to low seventies. A QSR should be above seventy. A steakhouse may sit in the low sixties because ingredient cost is structurally higher, and that is fine if the beverage attach and the average check are doing their job.
4. Operating expenses, grouped sensibly. This is the section where most amateur P&Ls fall apart. The right grouping is four sub-sections:
- Labor (BOH wages, FOH wages, payroll taxes, benefits). Always split BOH from FOH. The two move for different reasons and lumping them together kills your ability to act on the number.
- Occupancy (rent, utilities, common-area maintenance, property tax pass-through). These are usually fixed in the short term, but they are also the easiest place to find a saving at lease renewal.
- Controllable operating expenses (cleaning, smallwares, repairs, marketing, supplies, music, technology, credit card processing fees, third-party delivery commissions). Anything you choose to spend month by month sits here.
- Non-controllable operating expenses (insurance, licences, accounting and legal). Things you do not negotiate in any given month.
5. Operating profit (EBITDA). Gross profit minus the four operating-expense buckets above. This is the headline number most operators should focus on, because it is the cleanest measure of how the restaurant itself is performing, separated from how the business is financed or how the assets are being depreciated. A healthy independent restaurant runs at twelve to twenty percent EBITDA; elite operators reach the high twenties or low thirties.
6. Below the line. Interest expense, taxes, depreciation, and amortisation come off EBITDA. None of these are operational levers in any meaningful sense; they are largely outcomes of decisions made years ago (financing, capex). Tracking them matters for reporting but pulling on them does not change next month's performance.
7. Net profit. What is actually left. For a typical independent, net profit comes in at five to fifteen percent of revenue. If yours is consistently below five percent, the problem is almost always upstream - in COGS, labor, or occupancy - rather than below the line. Fix the operating sections first; the bottom line follows.

The restaurant P&L formula
The full P&L compresses into a short chain of arithmetic. Each line builds on the one above it.
Total revenue = food sales + beverage sales
Total COGS = food COGS + beverage COGS
Gross profit = total revenue - total COGS
Total labor = BOH wages + FOH wages + payroll taxes & benefits
Prime cost = total COGS + total labor
EBITDA = gross profit - total labor - occupancy - other operating expenses
Net profit = EBITDA - interest - taxes - depreciation - amortisation
Then come the four ratios that almost every operator decision ultimately routes through:
Food cost % = food COGS / food sales × 100. Always calculate against food sales only, never total sales. We covered the mechanics in depth in the food cost percentage guide.
Labor cost % = total labor / total revenue × 100. Includes wages, payroll taxes, and benefits. Anything that touches a human costs money; do not strip out taxes to make the number look flattering.
Prime cost % = (total COGS + total labor) / total revenue × 100. The single most important controllable number in a restaurant P&L, covered at length in the restaurant prime cost guide.
EBITDA % = EBITDA / total revenue × 100. The cleanest measure of operating performance and the number investors underwrite against.
Run your numbers through the calculator
Reading the formula is one thing. Watching it move in real time against your own figures is what makes it stick. The calculator below builds a full P&L from nine inputs and colour-codes each ratio against industry benchmarks: green is healthy, amber is something to watch, red is something to fix this week.
If you have never built a P&L for your own venue before, run a single month through it. Most operators are surprised by which ratio flags red. The most common discovery is not food cost (which gets the most attention) but labor cost (which often runs three to five points hot in restaurants that schedule by gut rather than by forecast). The second most common discovery is that occupancy plus controllable expenses combined have crept above twenty percent of revenue, usually because two or three small subscriptions, one mid-sized maintenance contract, and an undertracked marketing spend have all drifted up unnoticed.
Healthy P&L benchmarks by venue type
The single most damaging habit in restaurant finance is benchmarking against the wrong format. A fine dining restaurant comparing itself to a QSR is comparing two completely different businesses. The bands below are the most useful starting points for the formats independent operators actually run in 2026. Treat them as gravity, not gospel - a strong wine programme, a heavy delivery mix, or a punishing lease can shift any of them by several points.
- Quick service and fast casual - food cost 25 to 30 percent, beverage cost 15 to 22, labor 25 to 30, prime cost 50 to 60, EBITDA 15 to 22 percent. Tight format, very little ambient cost, and the highest EBITDA ceiling in the industry when executed well.
- Casual dining - food cost 28 to 32, beverage 18 to 22, labor 30 to 34, prime cost 58 to 65, EBITDA 10 to 16 percent. The format most independent operators run. The squeeze usually shows up in labor, not COGS.
- Pizza and pasta - food cost 22 to 28, beverage 18 to 22, labor 28 to 32, prime cost 50 to 60, EBITDA 14 to 20 percent. Structurally low COGS makes pizza one of the most forgiving formats in the industry, provided you do not give the margin away in toppings.
- Steakhouse, sushi, seafood - food cost 32 to 40, beverage 18 to 22, labor 28 to 32, prime cost 60 to 70, EBITDA 10 to 16. High ingredient cost is structural; the format wins on pricing power and beverage attach.
- Fine dining - food cost 28 to 35, beverage 22 to 28, labor 32 to 38, prime cost 60 to 68, EBITDA 8 to 14. Higher labor share is structural; what offsets it is average check.
- Bars with a food programme - food cost 30 to 35, beverage 18 to 24, labor 28 to 32, prime cost 55 to 62, EBITDA 14 to 20. Food is there to drive beverage attach; do not let the kitchen think its job is to be cheap.
- Hotel F&B - food cost 30 to 36, beverage 22 to 28, labor 32 to 38, prime cost 60 to 70, EBITDA 8 to 14. The hardest format to read because so many costs (utilities, cleaning, HR) flow through the hotel rather than the outlet.
Operators chasing the wrong band burn out trying to hit numbers that do not apply to them. A pizzeria at thirty percent food cost is in trouble; a steakhouse at thirty percent is over-performing. Pick the band that matches what you actually run and benchmark against that.

How to read your P&L weekly, not quarterly
The biggest gap between profitable and unprofitable restaurants is not the number on the P&L. It is how often the number is read. A P&L produced at month end, fourteen days after the period closes, is a historical document. By the time it lands you have completed roughly six trading weeks since the period started and you have lost the chance to act on anything inside it. A P&L produced weekly turns the same data into an operating tool.
The weekly rhythm that works in every well-managed restaurant we serve looks like this, and takes the management team about ninety minutes to execute end-to-end. We covered the operational version of this in our piece on restaurant improvement ideas; here is the financial version.
Sunday evening - close the trading week. Run the POS for total food sales, total beverage sales, and a daypart breakdown. Complete a physical food and beverage inventory count. Confirm every supplier invoice for the week is posted. This is the single hour of management time that makes every other step possible; skip it and the rest of the week is built on guessing.
Monday morning - the flash report. A fifteen-minute stand-up with the head chef and FOH manager. Five numbers on a whiteboard: revenue, food cost percentage, beverage cost percentage, labor cost percentage, prime cost percentage. Two questions: what moved compared to last week, and what is the single change we will make this week. Nothing else.
Wednesday afternoon - mid-week adjustments. If food cost is tracking hot, audit the back-of-house: are portions holding, is the prep batching right, are deliveries landing as forecasted. If labor is tracking hot, audit the schedule against the sales forecast for the back half of the week and trim hours where the forecast does not justify them.
Friday morning - the weekend brief. Confirm the weekend cover forecast, the weekend schedule, the weekend prep list, and any specials that lean on ingredients running long. Five minutes on Friday saves three hours of Sunday firefighting.
That is the entire process. Ninety minutes of management time a week. Done consistently across a year it moves prime cost two to four percentage points and EBITDA five to eight, which on a million-dollar independent is fifty to eighty thousand dollars of profit that would otherwise have leaked away unnoticed.

The six P&L mistakes that cost operators the most
Even experienced owners get the P&L wrong in surprisingly consistent ways. Watching for these six patterns catches most of the noise in your numbers.
1. Booking COGS from invoices rather than inventory. Invoices tell you what arrived; only the physical count tells you what was used. A P&L built on invoices will swing wildly month-to-month based on delivery timing, masking the underlying trend. Build COGS from inventory or do not build it at all. The same logic underpins every well-run restaurant inventory system.
2. Merging food and beverage everywhere. Two completely different margin profiles, two completely different operations. Lumping them together hides problems on both sides simultaneously. Split sales, split COGS, split percentages. The bar and the kitchen are two businesses sharing a roof.
3. Hiding payroll taxes and benefits below labor. Any P&L that reports a "labor cost percentage" stripped of payroll taxes and benefits is reporting a fictitiously low number. The true cost of a wage to the restaurant is the wage plus taxes plus benefits plus workers' compensation insurance. Treat them as one number, on one line, at one ratio.
4. Mixing capex into operating expenses. A new oven is capex, not opex. A monthly maintenance contract on the oven is opex. Confusing the two will either flatter or punish your P&L in any month a capital item is bought; both are misleading. If you are not sure, the test is duration: if the spend creates an asset that lasts more than a year, it is capex.
5. Ignoring inventory adjustments at month-end. The only way the P&L ties out to the bank account is if inventory is counted and adjusted at the close of every period. Skipping the count in any given month makes the next month's P&L meaningless, because you cannot calculate true usage without two real bookends. Inventory discipline is unglamorous. It is also the difference between a P&L that tells the truth and a P&L that tells a story.
6. Reading the document quarterly instead of weekly. A P&L read four times a year is a tax document. A P&L read fifty-two times a year is an operating tool. The same nine lines, read every week, become the lens through which the team sees the restaurant. Quarterly is too slow. Monthly is borderline. Weekly is where the leverage lives.
How modern POS and accounting automate the P&L
Doing this by hand once a month is fine for a single owner who is in the building every day. It does not scale to multiple sites, and it does not scale to operators trying to spend their attention on guests and team rather than spreadsheets. A modern restaurant technology stack collapses what used to be a fifteen-hour month-end exercise into a five-minute Monday-morning glance, by automating the three things that take the longest.
On the sales side, a modern restaurant POS splits food, beverage, and other revenue automatically by daypart, service, and channel. That alone makes the top half of the P&L correct at the source rather than reconstructed at month end.
On the cost side, an integrated stock management module maintains running ingredient balances against your recipe database, posts purchases against the right cost centre, and produces a theoretical food cost ratio that the actual physical count is checked against each week. Variances by ingredient surface ranked by dollar impact, so the team spends their time on the two or three lines actually moving the number.
On the financial side, a restaurant accounting platform closes the loop by pulling POS revenue, COGS adjustments, payroll, and supplier invoices into a single chart of accounts. The P&L rebuilds itself in the background; the operator opens it on Monday morning, reads the deltas against the prior week, and acts. Card processing and tipping flow through cleanly when payments are integrated into the same stack rather than reconciled afterwards from a separate provider's portal.
If you want to go deeper on how the accounting layer specifically fits into a restaurant tech stack, we covered the buyer's view in our restaurant accounting software guide. The headline point is that the P&L stops being a project you wait for and becomes a number you read.
From P&L to action: what to do on Monday
The P&L is only as useful as the change it provokes. The trick to acting on it is to read the same five questions every Monday, in the same order, and to refuse to be distracted by anything else until each one has an answer.
Did revenue move? If yes, is it covers or average check, and is it food or beverage that drove the change. Treat each combination as a different story; do not collapse them.
Did food cost percentage move? If yes, look first at theoretical vs actual variance. Wide variance points to portion drift, waste, or theft; narrow variance points to a menu mix shift or a supplier price move. Different causes, different fixes.
Did labor cost percentage move? If yes, was it a schedule problem (too many hours for the actual covers) or a productivity problem (right hours, wrong people). The first is a forecasting fix; the second is a training fix.
Did prime cost percentage move? If food and labor moved in the same direction, the underlying issue is usually demand forecasting. If they moved in opposite directions, you are watching substitution and the question is whether the trade is intentional.
What is the one change we will make this week? One change. Not five. The instinct to fix everything at once is the single biggest reason restaurant interventions fail. Pick one number, pick one change, run it for a week, then read the next P&L. A restaurant that runs this loop fifty times in a year will out-perform one that runs ten heroic projects.
If the loop sounds tedious, that is the point. The restaurants that thrive over a decade are not the ones run by the most charismatic operators. They are the ones run by the operators who do the same ninety minutes of P&L work every Sunday and Monday for ten years in a row. None of it is glamorous. All of it compounds.
Bringing it together
The restaurant P&L statement is the single most useful financial document an operator has, and the easiest to get wrong. Built around clean line items, read weekly rather than quarterly, benchmarked against the band for your format, and pushed through a modern POS and accounting stack so the arithmetic happens automatically, it stops being a tax document and becomes the operating tool that decides whether your restaurant grows or treads water.
The path is concrete. Split food and beverage everywhere. Calculate COGS from inventory, not invoices. Group operating expenses into labor, occupancy, controllable, and non-controllable. Read prime cost and EBITDA every Monday morning. Use the calculator above to track your ratios against industry benchmarks. Pair the document with the food cost percentage guide, the prime cost guide, and a quarterly menu engineering pass to push the numbers in the right direction. Most importantly, build a ninety-minute weekly rhythm and run it every single week without exception.
The restaurants that survive the next ten years will not be the ones with the most flair on the plate. They will be the ones whose operators can tell you their EBITDA percentage for last week, the biggest variance line against the week before, and what they decided to do about it on Monday morning.
Read next: Restaurant Procurement and Vendor Management: The 2026 Operator's Playbook for Lower Food Cost (with Free Vendor Cost Comparison Calculator) and Restaurant Payment Processing Fees: The 2026 Operator's Guide to Lowering Your Effective Rate (with Free Effective Rate Calculator) and Menu Pricing Strategy for Restaurants: The 2026 Operator's Playbook on How to Price Your Menu (with Free Menu Price Recommender).