
Most restaurant owners can quote their average check, their cover count and their best-selling dish without looking. Ask them their food cost percentage for last week and you will get a confident-sounding number that is almost always wrong, usually by three to five points, and almost always in the wrong direction. That gap matters more than any other piece of operational sloppiness in a restaurant, because a single point of food cost is roughly equivalent to one month of rent over a year for a typical independent.
Food cost percentage is the lever that decides whether the kitchen pays for itself or quietly bleeds the business dry. It is the cleanest single number in the P&L for measuring whether the kitchen is buying well, prepping accurately, portioning fairly, and selling the right mix of dishes. Get it right and a modest restaurant becomes profitable. Get it wrong by a few points and a busy one becomes a treadmill.
This guide covers what food cost percentage really is, the formula in plain English, healthy ranges for the formats most operators run in 2026, a worked example you can plug into a spreadsheet tonight, the difference between theoretical and actual food cost (the variance every operator should track), how to calculate plate cost properly, and a practical playbook for bringing the number down by three to five points without raising menu prices or compromising the food.

What is food cost percentage?
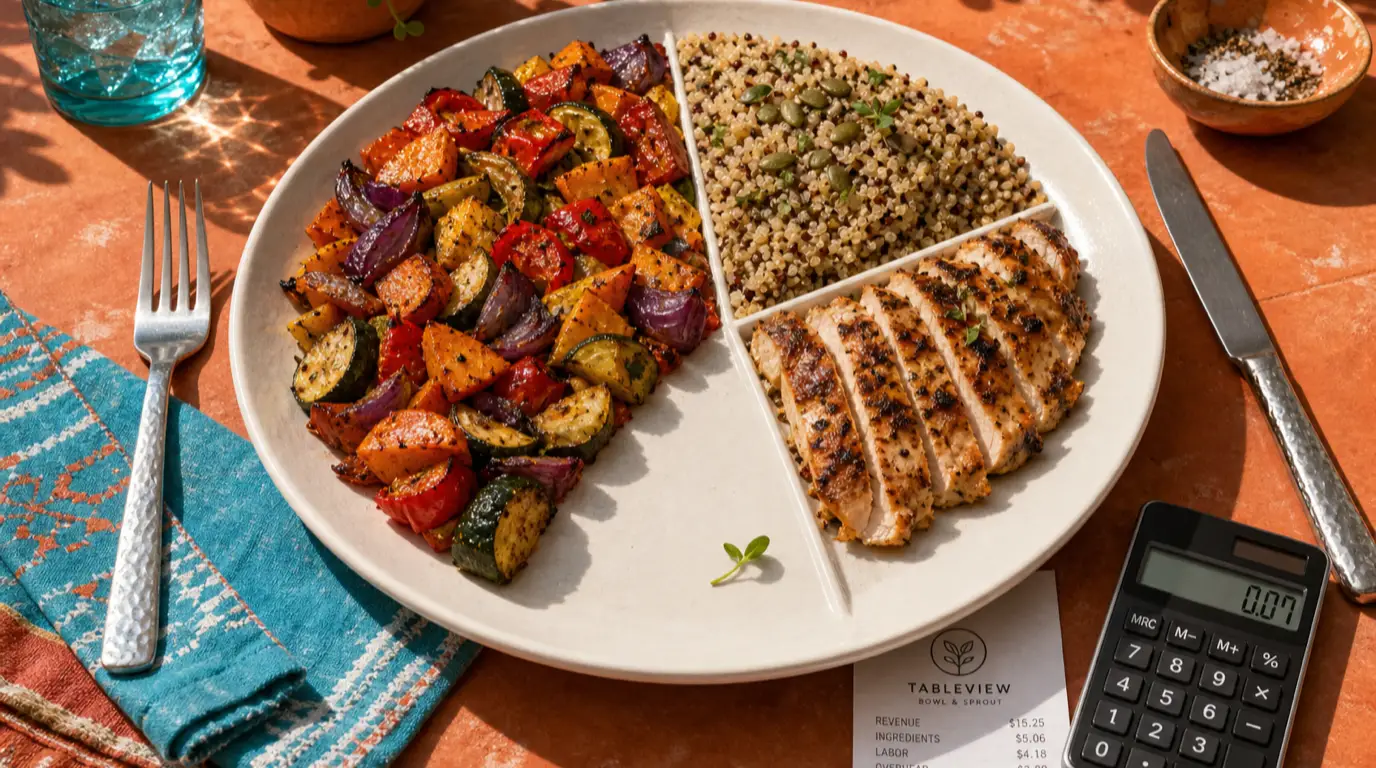
Food cost percentage is the share of every food sale that goes back out of the door as ingredient cost. If a restaurant rings $40,000 of food sales in a week and the kitchen consumed $13,200 worth of ingredients producing them, the food cost percentage for the week is 33 percent. Everything that is not food cost has to cover labour, rent, utilities, debt, owner pay, and profit, in that order. The lower the food cost percentage, the more room left over for everything else.
The metric only works if it is calculated against food sales, not total sales. Beverage carries a very different margin profile (wine and spirits typically run at 18 to 25 percent cost, soft drinks at 10 to 15) and lumping it in with food masks a kitchen problem behind a healthy bar. Most modern POS systems separate the two automatically, and any operator who is still merging them on a monthly P&L is reading a number that cannot be acted on. Pair it with the prime cost ratio (food plus labour combined) to see the full controllable-cost picture.
There are two parallel versions of the number that matter, and the gap between them is where most of the value lives. The first is actual food cost, which comes from a physical inventory count. The second is theoretical food cost, which comes from multiplying every sale by the recipe cost. The two should match within about one and a half percentage points. When they do not, the gap is where waste, theft, portion drift or measurement error is hiding.
The food cost percentage formula
The formula is short. The discipline of using it correctly is what separates well-run kitchens from struggling ones.
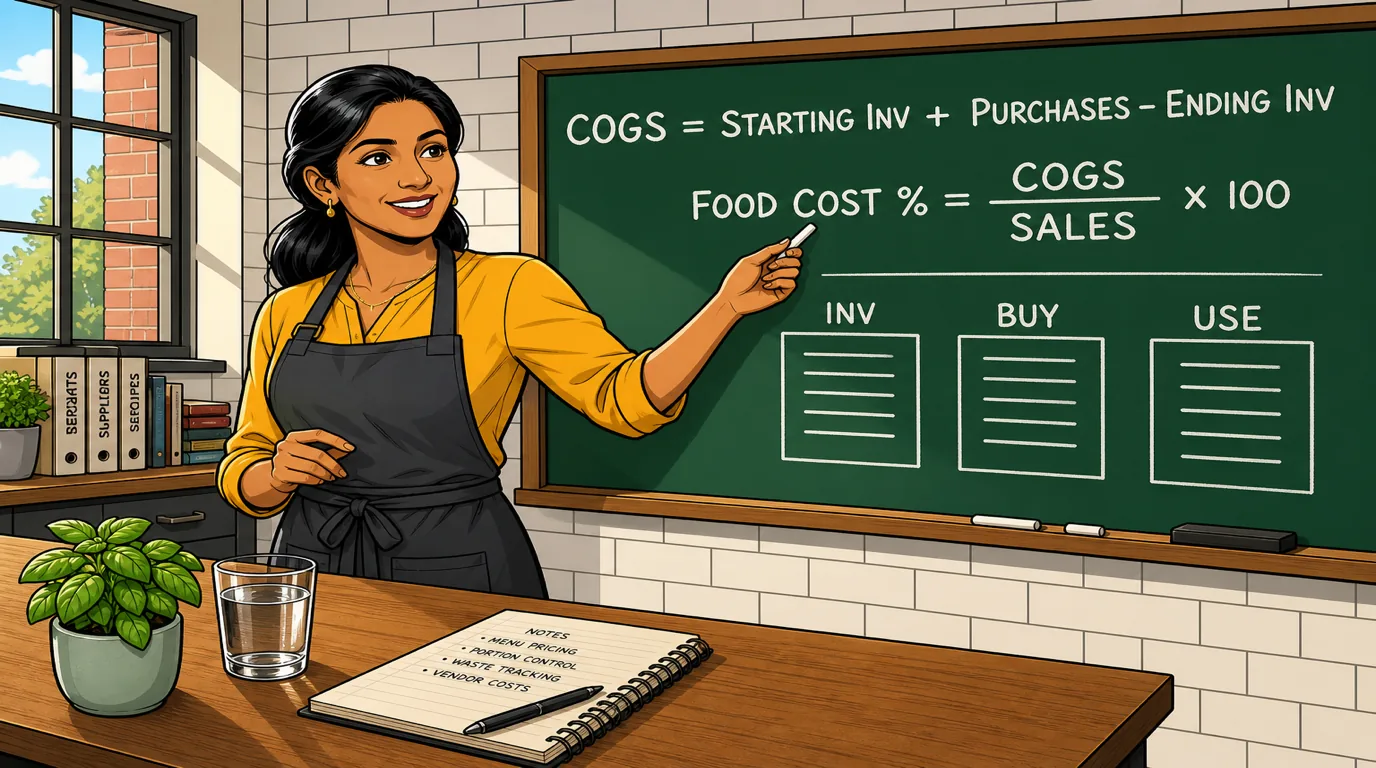
Cost of goods sold = Starting inventory + Purchases - Ending inventory
Food cost percentage = (Cost of goods sold / Food sales) × 100
Starting inventory is the dollar value of every edible item in the building at the start of the period, counted by hand. Purchases is every invoice received during the period, posted at landed cost. Ending inventory is the same physical count, repeated at the end of the period. The difference is what the kitchen actually consumed, regardless of what the invoices say arrived.
Two pitfalls trip up almost every operator who learns this formula for the first time. The first is using purchases as a proxy for usage, which dramatically overstates food cost in any week deliveries land and understates it the following week. The second is leaving open accruals out of the count: a kitchen that received a large produce order on Saturday but did not enter the invoice until Tuesday will book a mysteriously low food cost in week one and an alarming spike in week two. Following FIFO discipline in storage and posting invoices the day they arrive eliminates both problems for free.
What is a good food cost percentage?
There is no single right answer, but there are well-understood ranges by format. Two kitchens with the same food cost percentage can be in completely different financial shape if their formats sit on opposite ends of the band. The number to chase is the one that is healthy for the kind of restaurant you actually run.
Here is how the bands typically break down for the most common formats in 2026. Treat them as gravity, not gospel: a high-end ingredient list or a beverage-heavy mix can shift any of them by a few points.
- Quick service and fast casual: healthy at 25 to 30 percent. Lower average check is supposed to be offset by tighter recipe discipline and standardised portions.
- Pizza: healthy at 18 to 25 percent. The lowest food cost format in the industry, structurally, because flour, tomato and cheese cost so little against a $14 menu price. Operators who drift above 28 percent are usually giving away topping weight.
- Casual dining: healthy at 28 to 32 percent. Slightly more generous than QSR because plate complexity and protein share are higher.
- Italian, Asian and Mexican concepts: healthy at 26 to 32 percent. Carb-heavy menus carry low ingredient cost as long as portion discipline holds; protein-heavy plates pull the number toward the high end.
- Steakhouses, sushi and seafood: healthy at 32 to 40 percent. Premium ingredient cost is structural; operators win on pricing power and beverage attach rather than recipe yield.
- Fine dining: healthy at 28 to 35 percent. Tasting menus pull the number up; à la carte with a strong wine programme pulls it down.
- Coffee shops and bakeries: healthy at 25 to 30 percent on food, and 12 to 20 percent on drinks. The mix between the two is what makes the format unusually forgiving in slow hours.
- Bars with a food programme: healthy at 30 to 35 percent on food. The job of the food line in a bar is not to be cheap, it is to drive beverage attach and dwell time.
The old "30 percent rule" you still see in operations textbooks treats all of these formats as if they were one. They are not. Pizza hitting 30 percent is bleeding money. A steakhouse hitting 30 percent is over-performing. Use the band for your format, not the slogan.
A worked example you can copy
Let us calculate food cost percentage for a mid-size casual restaurant for a single trading week. Use round numbers so the arithmetic is easy to follow, then plug your own figures in tonight.
For the week, total food sales (net of tax, separated from beverage) come in at $40,000. The Monday-morning physical count valued food inventory at $11,000. Through the week, the kitchen received deliveries from food, produce and dry-goods suppliers worth $13,500 in total. The Sunday-night recount comes in at $10,800.
Cost of goods sold = 11,000 + 13,500 - 10,800 = $13,700.
Food cost percentage = 13,700 / 40,000 = 34.25 percent.
For a casual restaurant, 34.25 percent is two to four points above the healthy band. Translated into the P&L, that is roughly $1,000 of margin leaking out of the kitchen every week, or just over $50,000 a year that should be in the owner's pocket and is instead being thrown away. The rest of this guide is about closing that gap, methodically, without buying cheaper ingredients or shrinking portions to a point guests notice.
Theoretical vs actual food cost: the variance that matters
Actual food cost is what physical inventory says you used. Theoretical food cost is what the recipes say you should have used given the dishes your POS sold. If the recipe for a chicken sandwich calls for 180 grams of breast and you sold 250 sandwiches, theoretical chicken usage is exactly 45 kilograms. Actual usage almost never matches.
The gap between the two is the most useful diagnostic any operator has. A healthy kitchen runs an actual-versus-theoretical variance of less than one and a half percentage points. Anything more than that is, by definition, one of four problems: waste (trim, prep loss, spoilage, overproduction), theft (staff meals, takeaway out the back door, supplier short shipments), portion drift (recipes drifting in execution because the line is trained on muscle memory rather than scales), or measurement error (counts done quickly or recipes coded incorrectly in the POS).
Each cause has a different fix, and the variance number tells you which one you have. Wide variance on protein and produce is almost always portion drift. Wide variance on dry goods is usually theft or waste. Wide variance everywhere at once is usually measurement error in the inventory count itself. Running this diagnostic monthly turns food cost from a number you watch into a number you can move.
Computing theoretical food cost manually for an independent is impractical. An integrated restaurant inventory system that knows your recipes and your POS sales does it automatically and ranks the largest dollar-value variances by ingredient. The first time you run that report you will almost always discover one or two ingredients responsible for half the gap, and the fix will take a single line meeting.
Plate cost: the recipe-level math operators get wrong
Plate cost is the ingredient cost of producing one serving of a specific dish, from raw materials through to the plate at the pass. Food cost percentage is the aggregate; plate cost is the unit economics. Both numbers matter, and a healthy restaurant tracks the plate cost of every dish on the menu at least quarterly.
The arithmetic looks straightforward and trips up almost every operator who tries it for the first time. The most common mistake is using the as-purchased price of an ingredient instead of the edible-portion price. A whole side of salmon at fifteen dollars per kilogram seems cheap until you trim, debone and portion it, at which point the actual usable yield is closer to sixty percent and the real cost per portioned kilogram is twenty-five dollars. Skip that adjustment and every salmon dish on your menu will show a fictitiously healthy plate cost.
The second common mistake is forgetting the supporting cast. The plate cost of a steak is not just the steak; it is the steak plus the sauce, the side, the garnish, the bread service, the butter ramekin and the lemon wedge. Each of those is usually trivial in isolation, but adding them up across the menu often discloses a hidden two to three percentage points of cost that the operator was treating as free.
The third common mistake is leaving comps, voids, and staff meals out of the calculation. Anything that leaves the kitchen has a real food cost, regardless of whether it generated a sale. A restaurant that comps three meals a night to placate guests, plus feeds eight staff during the shift, is giving away roughly a tenth of a percentage point of food cost per cover. Track these honestly. The number shocks people the first time they see it.
How to lower food cost percentage without raising prices
There is a strong instinct, when food cost drifts up, to either raise prices or buy cheaper ingredients. Both are usually wrong. Price rises hurt covers if they outpace what the market will bear, and cheap substitutions are detected by guests immediately. The right answer almost always lives inside the operation. Most well-run restaurants find three to five percentage points of food cost reduction without changing the menu or the suppliers, by attacking five levers in sequence.
Lever one is portion discipline. Most kitchens are giving away two to four percent of their food cost in generous pours, oversized scoops and rounded-up garnishes that nobody ever calibrated. A digital scale on the line, a printed portion chart at each station, and a manager who walks the line during service recovers that two to four points inside a month, with no menu changes and no awkward conversations with suppliers.
Lever two is menu mix. Not every item on a menu earns its place. Some contribute great margin but barely sell; others sell constantly but have crept into low-margin territory because the supplier cost moved and the menu price did not. A quarterly menu engineering pass sorts every dish into one of four buckets - stars, plowhorses, puzzles, and dogs - and tells you which to promote, which to re-price, which to redesign, and which to remove.
Lever three is waste. Reducing food waste in a restaurant is partly a back-of-house process problem (rotation, par levels, prep batching, nose-to-tail thinking) and partly a front-of-house discipline problem (correct upselling, allergen handling, return-rate tracking). A waste log kept honestly for two weeks usually reveals one or two patterns responsible for half the loss, and they are almost always fixable inside a single team meeting.
Lever four is yield management. The same chef who trims sixty percent yield out of a salmon side this week can train their team to hit sixty-eight next week without any change in plate quality. Bone-in proteins, leafy produce, and citrus all carry hidden yield gains that disciplined prep recovers quickly. A whole-protein butchery class for the line cooks pays for itself inside a quarter.
Lever five is supplier audit. Quarterly, pull the last three invoices from every major supplier and compare the per-unit prices for the items that move most. Producers raise prices quietly, betting that nobody is watching. A proper procurement workflow catches those drifts automatically and gives you the leverage to push back at the next negotiation. Even a one percent improvement on the top ten ingredients flows straight to the bottom line.

When to raise menu prices (and when not to)
Sometimes the right answer really is a price rise. The trick is knowing when. Operators who raise prices first, before exhausting the operational levers above, tend to lose covers; operators who refuse to raise prices at all, even when input costs have moved structurally, tend to slowly squeeze the margin out of the business. There is a narrow window where a price rise is the correct move, and it has three preconditions.
The first is sustained input cost pressure. A single bad month on beef or a spike on olive oil during a heatwave is noise; do not move prices on noise. A six-month upward trend on a major ingredient is signal; price changes follow signal, not noise.
The second is competitive room. If every comparable restaurant in your trading area has already moved their prices, you have permission to move with them. If you would be the first, expect a measurable cover hit and decide whether the margin gain is worth it.
The third is the engineering: never raise prices uniformly. Raise the dishes that are already best-sellers and inelastic to small changes, hold the prices of the items used as decoys or comparison anchors, and consider lowering the price of one or two items strategically to make the average check feel friendlier. A menu engineered around price elasticity will pull the average check up without spooking the regulars.
How POS and inventory automate the whole loop
Doing all of this by hand once a month is fine for a single owner who is in the building seven days a week. It is not fine for anyone trying to grow, hand off, or run more than one venue. Modern POS reporting combined with integrated inventory turns the monthly arithmetic exercise into a weekly habit and surfaces variances at the ingredient level rather than the kitchen level.
On the sales side, a modern restaurant POS gives you food sales by item, daypart and category, separated from beverage and broken down by service. That alone makes the food-cost calculation possible to do honestly.
On the inventory side, an integrated stock management module maintains running ingredient balances against recipes, posts purchases against the right cost centre, and produces a theoretical food cost automatically. Compared against the actual physical count at the end of each week, the system surfaces variance by ingredient ranked by dollar impact, so the team can spend their attention on the two or three ingredients actually moving the number rather than auditing everything at once.
Tying both halves together is the job of restaurant accounting software. Sales, COGS adjustments, payroll runs and supplier invoices all flow into a single chart of accounts inside a restaurant accounting platform, so food cost percentage is one number you read in the morning rather than a project you wait for the bookkeeper to deliver at month end. For a multi-venue operator that visibility is non-negotiable; for a single site it is the difference between running the restaurant and being run by it.

Common food cost mistakes operators make
Even experienced owners get food cost percentage wrong in surprisingly consistent ways. Watching for these six patterns will catch most of the noise in your numbers.
The first mistake is calculating monthly instead of weekly. A month is too long a feedback loop for an operating restaurant. By the time the number lands, four trading weeks have happened and you have lost the chance to course-correct. Weekly is the right cadence.
The second mistake is using purchase invoices for COGS instead of inventory. Invoices tell you what arrived. Only inventory tells you what was actually used.
The third mistake is merging food and beverage. The two have completely different margin profiles, and lumping them together masks a kitchen problem behind a healthy bar or hides a bar problem behind a tight kitchen.
The fourth mistake is forgetting comps, voids and staff meals. Anything that leaves the kitchen has real ingredient cost. Track it honestly or you will keep over-stating margin.
The fifth mistake is using as-purchased prices in plate cost calculations. Edible-portion cost (after trim, yield and waste) is the only honest number for menu engineering.
The sixth mistake is benchmarking against the wrong format. A steakhouse comparing itself to a QSR is comparing apples to oranges. Find two or three operators in your own format whose numbers you trust and benchmark against them.
A weekly food cost rhythm that catches drift early
Reading about food cost is one thing. Building a weekly rhythm that puts the number in front of the right people at the right time is what moves the needle. A version of this rhythm runs in every well-managed restaurant we work with, and it takes the management team about ninety minutes a week to execute.
Sunday evening. Close the trading week. Pull the POS food sales report, run a physical food-inventory count, post every outstanding supplier invoice, and confirm the recipe database is current. The shift manager or assistant manager owns this step. Total time: sixty minutes.
Monday morning. A fifteen-minute food cost stand-up with the head chef. Three numbers on a whiteboard: actual food cost percentage, theoretical food cost percentage, and the variance. Two questions: what moved compared to last week, and what is the one change we will make in the coming week. Nothing else.
Wednesday afternoon. A mid-week purchasing audit. If a particular ingredient looks like it will run hot for the week, adjust orders for the rest of the week before they lock in. If the week is tracking healthy, confirm the weekend order is correctly sized for forecast covers.
Friday morning. A menu-mix snapshot. If a particular item has slipped sharply on margin or popularity through the week, decide whether to feature it in the weekend specials or pull it quietly until the next menu refresh.
That is the entire process. Ninety minutes of management time a week, against a five-figure annual margin swing for any restaurant doing more than a million in revenue. The reason the rhythm works is not the brilliance of the meeting agenda; it is that the conversation happens every single week. Food cost is a habit metric, not a project metric.
Bringing it together
Food cost percentage is the single biggest controllable line on the P&L. It captures whether the kitchen is buying well, prepping accurately, portioning fairly and selling the right mix. It is the foundation for prime cost, the headline number that combines food and labour together, and it is the lever every profitable kitchen pulls every week.
Get the formula right, calculate it weekly against food sales only, benchmark it against the band for your format, and put it in front of the head chef on the same Monday morning every week. Drive it down by combining portion discipline, a quarterly menu engineering pass, an honest waste log, disciplined yield management and a quarterly supplier audit. Use a modern POS and an integrated stock management module to compute theoretical vs actual food cost automatically so the team can spend their attention on the variances that actually move the number.
None of these moves is glamorous, and none of them require a new concept or a refit. They require a routine. The restaurants that survive the next decade will be the ones whose owners can tell you their food cost percentage for last week, the variance against theoretical, and what they did about it on Monday.
Read next: Restaurant Procurement and Vendor Management: The 2026 Operator's Playbook for Lower Food Cost (with Free Vendor Cost Comparison Calculator) and Menu Pricing Strategy for Restaurants: The 2026 Operator's Playbook on How to Price Your Menu (with Free Menu Price Recommender) and Menu Engineering: A Practical 2026 Guide to Pricing and Margin.