Most restaurant books have one account called something like "Food and beverage purchases", and that single line is the reason the owner can't say whether the wine list makes money. A restaurant chart of accounts decides which questions your numbers will ever be able to answer. Set it up badly and no amount of restaurant accounting software, bookkeeper hours or year-end heroics will split a lump back into the pieces you needed.
The chart is also the place where the two ends of the business meet. Sales arrive from the till every night, already broken down by category. Costs arrive from suppliers as invoices, and if you buy through restaurant procurement software with purchase orders, each invoice already knows whether it was meat, wine or oven cleaner. A good chart lets those two streams line up, food sales against food cost and beer sales against beer cost, so the percentages you watch every week actually mean something.
None of it is glamorous. It's a numbered list, set once and mostly left alone for years, which is exactly why it's worth an afternoon to get right. You can skip most of that afternoon: the sample chart below is a free download, as a PDF to print or an Excel file to edit.
What is a restaurant chart of accounts?
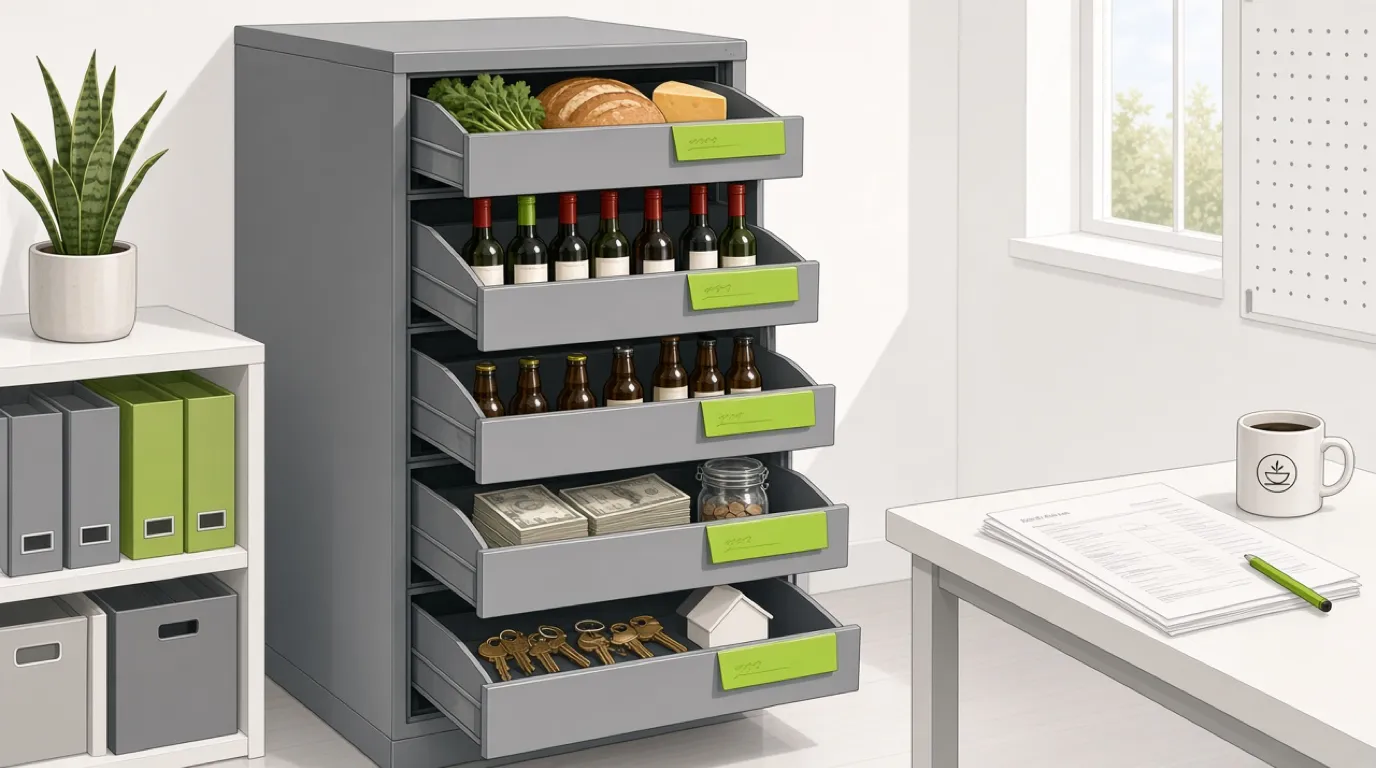
A restaurant chart of accounts is the numbered list of every account a restaurant's books use to record sales, costs, assets, debts and the owners' equity.
- Sales by menu category
- Cost of food and drink
- Labour and payroll taxes
- Money held for others
- Rent, utilities and overheads
The chart sits underneath the general ledger, so every transaction from the till, the bank or a supplier invoice lands in exactly one numbered account.
A restaurant chart of accounts usually lives in one of three places:
- A general accounting package such as Xero, QuickBooks, Sage or DATEV
- Built into restaurant accounting software fed by the POS
- A spreadsheet kept by the bookkeeper, in smaller venues
In short: a restaurant chart of accounts is the filing system for your money, and the P&L can only be as detailed as the folders in it.
Chart of accounts vs general ledger
People use the two terms as if they meant the same thing, and accountants wince every time. They're related the way the labels on a filing cabinet are related to the papers inside it.
Chart of accounts
The list of accounts, each with a number, a name and a type. It holds no amounts at all, only the structure.
General ledger
The record of every transaction, posted to accounts taken from the chart. Each line carries a date, an amount, a debit or a credit, and the account it hit.
Key distinction:
- The chart of accounts says where money is allowed to go.
- The general ledger records where it actually went, and the P&L and balance sheet are summaries of it.
A third term turns up in Britain: nominal codes. That's simply what Sage and most UK bookkeepers call the account numbers, and the "nominal ledger" is the general ledger under another name.
The six types of account in a restaurant chart
Accounting textbooks list five account types. Restaurants nearly always pull cost of sales out of expenses and give it a range of its own, because it's the number you manage hardest and the one that moves fastest when something goes wrong.
| Type | Usual range | What it holds | Restaurant examples | Reports on |
|---|---|---|---|---|
| Assets | 1000-1999 | What the business owns or is owed | Till cash, bank, card clearing, stock, kitchen equipment | Balance sheet |
| Liabilities | 2000-2999 | What the business owes | Suppliers, VAT or sales tax, staff tips, gift cards, deposits | Balance sheet |
| Equity | 3000-3999 | What belongs to the owners | Capital paid in, drawings, retained profit | Balance sheet |
| Revenue | 4000-4999 | Money earned from guests | Food, wine, beer, spirits, soft drinks, events | P&L |
| Cost of sales | 5000-5999 | What the sold items cost to buy | Food, wine, beer, spirits, packaging | P&L |
| Expenses | 6000-8999 | Everything else it costs to open | Wages, rent, utilities, card fees, repairs | P&L |
The ranges are convention, not law, at least in the US and the UK. They exist so that anyone who has read a set of books can open yours and know that a 4-something is a sale and a 7-something is an overhead. Several European countries are much stricter about it, which gets its own section further down.
A restaurant chart of accounts template
Below is a working chart for an independent full-service restaurant with a bar, somewhere between 60 and 120 seats. It comes to 70 accounts. Download it, delete what you don't use, and resist adding anything until a real question demands it. The Excel version has one row per account, so you can rename lines, add sub-accounts and filter by type before you set it up in your accounting software.
The numbering leaves gaps on purpose. Drinks run 4020 to 4050 in steps of ten, so when you start pouring cocktails on tap there's a 4045 waiting and nothing has to be renumbered.
1000 to 1999: assets
- 1010 Cash in tills and safe
- 1020 Main bank account
- 1030 Tax reserve account
- 1110 Card clearing
- 1120 Delivery platform clearing
- 1130 Third-party vouchers receivable
- 1210 Food stock
- 1220 Beverage stock
- 1310 Prepaid insurance and licences
- 1320 Rent deposit
- 1510 Kitchen equipment
- 1520 Furniture and fittings
- 1530 POS and IT hardware
- 1590 Accumulated depreciation
2000 to 2999: liabilities
- 2010 Suppliers payable
- 2110 VAT or sales tax payable
- 2120 Payroll taxes payable
- 2130 Wages payable
- 2210 Tips payable to staff
- 2220 Service charge to distribute
- 2310 Gift cards outstanding
- 2320 Booking and event deposits
- 2410 Company credit card
- 2510 Equipment finance
- 2520 Bank loan
3000 to 3999: equity
- 3010 Owners' capital
- 3020 Owners' drawings
- 3900 Retained earnings
4000 to 4999: sales
- 4010 Food sales
- 4020 Wine sales
- 4030 Beer and cider sales
- 4040 Spirits and cocktail sales
- 4050 Soft drinks and coffee sales
- 4110 Delivery and takeaway sales
- 4210 Private events and venue hire
- 4310 Retail and merchandise
- 4910 Discounts and comps
5000 to 5999: cost of sales
- 5010 Food cost
- 5020 Wine cost
- 5030 Beer and cider cost
- 5040 Spirits cost
- 5050 Soft drinks and coffee cost
- 5110 Takeaway packaging
- 5310 Retail and merchandise cost
6000 to 6999: labour
- 6010 Kitchen wages
- 6020 Front-of-house wages
- 6030 Management salaries
- 6110 Employer payroll taxes and social security
- 6120 Pensions and benefits
- 6130 Staff meals
- 6210 Recruitment and training
7000 to 7999: operating expenses
- 7010 Card processing fees
- 7020 Delivery platform commission
- 7110 Marketing and advertising
- 7210 Gas, electricity and water
- 7310 Repairs and maintenance
- 7320 Cleaning supplies and chemicals
- 7330 Smallwares and breakage
- 7340 Linen and laundry
- 7410 Software subscriptions
- 7510 Accounting and legal fees
- 7520 Licences and permits
- 7610 Insurance
- 7910 Music and entertainment
8000 to 8999: occupancy and below the line
- 8010 Rent
- 8020 Property taxes and landlord charges
- 8030 Equipment leases
- 8110 Depreciation
- 8210 Interest
- 8910 Income or corporation tax
Three choices in that list deserve a second look, because they're the ones a default software chart gets wrong.
Discounts and comps sit as a negative sales account, 4910, not as an expense. Gross sales stay honest, and anyone comping too freely shows up as a jump in one line you can read in ten seconds. The detail behind that line, who comped what and why, lives in your voids and comps report on the till.
Staff meals get their own account, 6130, instead of hiding in food cost. Feed a dozen people a shift meal every day at three euros a head and you're carrying around 250 euros a week that has nothing to do with what guests ate. Leave it in 5010 and your food cost looks a point or two worse than it is, and somebody wastes a month hunting for a portioning problem that doesn't exist.
And every sales account has a cost account ending in the same digits: 4020 wine sales, 5020 wine cost. That pairing is the whole reason for the structure.
Why every sales account needs a matching cost account
Here's a month at the same restaurant with drinks and food lumped together. Sales of 184,000 euros, cost of sales of 57,110. That's 31%, and 31% looks fine. Nobody calls a meeting about 31%.
Now split it using the pairs:
| Category | Sales | Cost | Cost % |
|---|---|---|---|
| Food | 120,000 | 40,800 | 34% |
| Wine | 32,000 | 9,600 | 30% |
| Beer and cider | 11,000 | 2,860 | 26% |
| Spirits and cocktails | 7,000 | 1,330 | 19% |
| Soft drinks and coffee | 14,000 | 2,520 | 18% |
The kitchen is running at 34%, several points above where most full-service menus want to be, and the bar is quietly covering for it. Wine at 30% is also high for a list with normal markups, which usually points to a few bottles priced at a flat amount over cost instead of a multiple. Neither problem was visible in the combined number. Both are obvious in about four seconds once the accounts are paired, and the percentage behind each row is exactly the food cost percentage you'd calculate by hand.
How a restaurant chart of accounts works
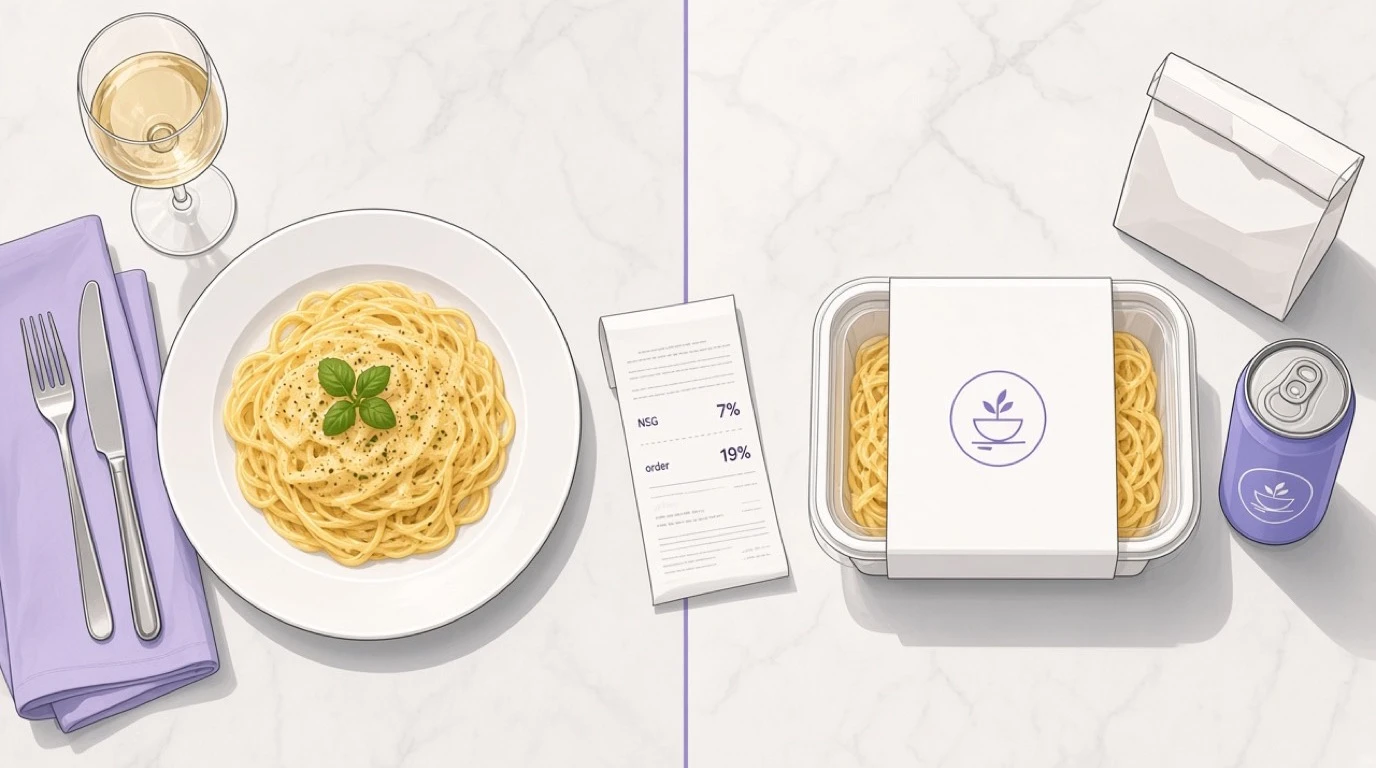
Follow one Friday at a 70-seat trattoria in Munich from the till to the P&L. Germany makes a useful example because food eaten in carries 7% VAT and drinks carry 19%, so the chart has to keep them apart from the very first posting.
1. The night's sales close on the till
At close the POS shows net sales of 8,845 euros: 5,720 of food, 1,630 of wine, 512 of beer, 319 of spirits and 664 of soft drinks and coffee. On top of that sits 400.40 of VAT on the food at 7% and 593.75 on the drinks at 19%. Guests also left 412 euros of tips on their cards.
2. The whole day posts as one journal
The day goes into the ledger as a single entry, not 180 separate bills. Money came in two ways, 1,050 euros in cash and 9,201.15 on cards, so 10,251.15 in all, and that total is spread across the accounts it belongs to:
| Account | Debit | Credit |
|---|---|---|
| 1010 Cash in tills and safe | 1,050.00 | |
| 1110 Card clearing | 9,201.15 | |
| 4010 Food sales | 5,720.00 | |
| 4020 Wine sales | 1,630.00 | |
| 4030 Beer and cider sales | 512.00 | |
| 4040 Spirits and cocktail sales | 319.00 | |
| 4050 Soft drinks and coffee sales | 664.00 | |
| 2110 VAT payable | 994.15 | |
| 2210 Tips payable to staff | 412.00 |
Look at what isn't a sale. The 994.15 of VAT belongs to the tax office and the 412 of tips belongs to the staff, so both go straight to liabilities. Book them as revenue and the trattoria looks about 16% bigger than it is, which is a pleasant feeling right up until the VAT return. Whether a service charge is revenue or money you hold for staff depends on your policy and your country, and the difference is set out in service charges and tips.
3. The card money arrives, minus fees
Two days later the processor pays 9,063.13 into the bank. The missing 138.02 is the card fee, 1.5% of the takings. The bookkeeper debits the bank with what arrived, debits 7010 card processing fees with 138.02, and credits card clearing with the full 9,201.15. Card clearing drops back to zero.
That zero is the check. A clearing account that won't empty means a payout is missing, a refund was never booked, or the fees are higher than the contract said. Glance at it every week.
4. Supplier invoices land in the matching cost accounts
Monday's invoices arrive: 1,480 euros from the butcher and the vegetable supplier, 860 from the wine merchant, 240 from the brewery. Each goes to its own cost account, 5010, 5020 and 5030, with the VAT on it booked against the VAT account to be reclaimed. A mixed invoice from a cash-and-carry gets split line by line. That's tedious the first time and automatic once the system remembers which products are which.
5. Month end turns purchases into cost of sales
What you bought isn't what you used. On the last night of the month the team counts the stock, and the change between opening and closing stock adjusts each cost account. Cost of sales is opening stock, plus purchases, minus closing stock. If the walk-in held 2,100 euros of food on the 1st and 2,650 on the 31st, the extra 550 comes out of 5010 and goes into 1210 food stock, because nobody has eaten it yet.
6. The P&L reads straight off the chart
Nothing has to be rebuilt in a spreadsheet. Food sales against food cost, wine against wine, labour against total sales, rent against everything. If you want to test your own numbers against typical ranges, the P&L calculator lays out the same lines in the same order.
What to look for in a restaurant chart of accounts
Whether you're building a chart from scratch or auditing the one your software shipped with, these are the things that separate a chart you can manage from one you just file into. Each ends with a question to put to your bookkeeper. If the answer takes longer than a minute, the chart is the problem.
1. Sales split the way your menu is split
Food, wine, beer, spirits, soft drinks. Then add a channel split only where it changes a decision: delivery gets its own line because it carries commission and packaging, private events because they're priced and staffed differently. Where your country has more than one VAT rate, the split by rate has to exist somewhere, either in the sales accounts or in the tax codes attached to them.
Ask: can I see last month's wine sales on their own without opening the POS?
2. Cost accounts that mirror the sales accounts
Every revenue category with its own cost of sales account, matched by number. Without the pairing, you can calculate a total cost percentage and nothing else.
Ask: what was our beer cost percentage in August?
3. Labour split between kitchen and floor
Kitchen wages, front-of-house wages and management salaries on separate lines, with employer taxes and benefits on lines of their own. The split matters because the two halves respond to different levers. Kitchen labour moves with menu complexity and prep, floor labour with covers and opening hours, and payroll taxes move whenever the government changes a rate.
Ask: what did the kitchen cost last month, including employer contributions?
4. A home for money that isn't yours
Tips owed to staff, a service charge waiting to be distributed, gift cards sold but not yet spent, deposits for bookings that haven't happened, VAT or sales tax collected for the government. All of it passes through your bank account and none of it is revenue.
Gift cards catch people out most often. A 100-euro card sold in December is a liability in December and a sale in March when somebody spends it. Book it as revenue on the day it's sold and you've inflated December, paid tax early, and in some US states you may have unclaimed property rules to deal with on the cards nobody ever redeems.
Ask: how much do we owe in unredeemed gift cards today?
5. A clearing account for every way money arrives
Cards, each delivery platform and third-party vouchers each get a clearing account that fills when the sale happens and empties when the money lands. Card processors pay daily or every few days, platforms weekly, and voucher companies whenever they feel like it. A clearing account turns "did we get paid?" from an afternoon of matching statements into a single balance.
Ask: which delivery platform payouts are still outstanding?
6. Gross sales, with the costs shown as costs
Book delivery sales at the full price the guest paid and the platform commission as an expense in 7020. The common shortcut is to book whatever the platform actually transferred as the sale. On 1,000 euros of delivery orders at 30% commission, that's 700 of sales, and the 320 of food behind those orders now reads as a 46% food cost instead of 32%. The commission, the one number you could actually negotiate, has vanished from the P&L entirely.
Ask: is our delivery revenue booked gross or net?
7. Locations as tags, not copies of the chart
A second site shouldn't mean a second set of accounts. Keep one chart and tag every transaction with its location, using what Xero calls tracking categories and QuickBooks calls classes or locations. Copy the chart per site instead and 4010 becomes 4010, 4011 and 4012, the chart grows with every opening, and comparing two sites means building a spreadsheet by hand.
Ask: can I see food cost for each site side by side, from one report?
How many accounts does a restaurant need?
Fewer than you'd think. A single-site restaurant runs well on somewhere between 50 and 90 accounts. Go under 40 and you'll be lumping together things you need apart. Go over 150 and the bookkeeper starts coding each invoice to whichever account sounds closest, which is worse than having fewer.
The test for any new account is blunt: will somebody look at this number on its own and do something differently because of it?
Two rules of thumb help with the audit. If an account had fewer than five postings last year, merge it into its neighbour. If one account carries more than a tenth of your total costs and it isn't food, labour or rent, it's probably two accounts pretending to be one.
The Uniform System of Accounts for Restaurants
There is an industry standard in the US, and most operators have never opened it. The Uniform System of Accounts for Restaurants, usually shortened to USAR, is published by the National Restaurant Association. The current edition, the eighth, came out in 2012. Nobody is legally required to follow it. It's a shared layout, so that a lender, a buyer or a franchisor can read any restaurant's P&L in the same order.
That order runs like this. Sales first, then cost of sales, then labour, with prime cost as the subtotal of the two. After that come the other controllable expenses, the ones a general manager can influence: direct operating costs, marketing, utilities, repairs and administration. Then occupancy and the other costs a manager can't touch, such as rent, equipment leases and depreciation. Interest and tax come last.
The split between controllable and non-controllable costs is the most useful idea in the whole book. It tells you which part of the P&L a general manager should be judged on, and which part belongs to the owner and the lease. The template above follows the same order, so prime cost falls out of it as cost of sales plus labour, with no reshuffling.
Hotels have their own equivalent, the Uniform System of Accounts for the Lodging Industry, which treats food and beverage as one department among several. If your restaurant sits inside a hotel, the accounts follow that structure instead, and hotel food and beverage management covers how it shapes the F&B numbers.
Charts of accounts in Germany, France, Spain and Italy
Outside the US and the UK, the chart often isn't yours to design from a blank page. Several European countries have a national standard chart, and your accountant will expect the books to follow it. The template above still helps, because the category splits it makes are the ones you'll want as sub-accounts underneath the national structure.
Germany: SKR 03 and SKR 04
Most German restaurants use one of the standard charts published by DATEV, SKR 03 or SKR 04. The law doesn't require either, but nearly every Steuerberater works in one of them. SKR 03 puts revenue in class 8, so food sold at 7% and drinks at 19% usually go to 8300 and 8400. SKR 04 follows the order of the balance sheet and puts the same revenue in class 4, at 4300 and 4400. Since food eaten in moved to 7% at the start of 2026, keeping those two revenue lines apart has stopped being a nicety, and the rates themselves are set out in restaurant VAT rates.
France: the plan comptable général
French companies keep their books on the plan comptable général, and this one isn't optional. Accounts are grouped into numbered classes: class 6 for charges, class 7 for revenue, class 4 for third parties such as suppliers, staff and the tax office. You can add sub-accounts below the standard ones, which is how a restaurant separates food from wine, but you can't invent your own top-level structure.
Spain: the plan general de contabilidad
Spain works on the same principle. In the plan general de contabilidad, group 6 holds purchases and expenses and group 7 holds sales and income. Food and drink bought in usually sits under 600 or 601, staff costs under 640 and 642, and the VAT charged to guests under 477. Restaurants open sub-accounts beneath those to keep food and drink apart.
Italy: the piano dei conti
Italy has no compulsory national chart. Each business keeps its own piano dei conti, but the annual accounts must follow the balance sheet and income statement formats laid down in the civil code, so in practice accountants build charts that map straight onto them. A restaurant that follows that structure and splits food from drink underneath ends up close to the template above.
How to adapt the chart to your type of restaurant
The template fits a full-service room with a bar. Other formats keep the skeleton and change the detail.
Full-service restaurants
Wine usually deserves more than one line. Split wine by the glass from wine by the bottle if the list is long, because the two run at very different costs and the glass pour is where waste hides. Private dining and events get their own revenue line, and for full-service restaurants the service charge account matters more than anywhere else.
Bars and clubs
Drinks are the business, so split them further: draught beer from bottled, spirits from cocktails, and an account each for door entry and cloakroom if you charge for them. Pour cost per category is the number you'll manage hardest. A POS for bars and clubs already sorts the sales that way at the till, so the chart only has to match it.
Takeaway and delivery
Packaging belongs in cost of sales, not in overheads, because it scales with every order. Give each delivery platform its own clearing account and its own commission line, so you can see which one actually earns you money after fees. A takeaway POS system that tags orders by channel makes those splits automatic.
Hotel restaurants
Each outlet becomes a department with its own revenue and cost, and anything charged to a room goes to the guest ledger rather than to cash or cards, until the guest checks out and pays. In hotel F&B the restaurant's chart has to fit the hotel's, not the other way round.
Groups with several sites
One chart with location tags, as above, plus a head-office location for central costs such as the operations manager and group marketing, so each site's P&L shows only what the site controls.
Changing the chart of accounts you already have
Most operators reading this already have a chart, usually the default the software came with plus five years of accounts somebody added at midnight. You don't need to start again. You need a map.
- Export the trial balance and list every account that had a posting in the last twelve months. The rest can probably go.
- Build a two-column sheet: old account on the left, new account on the right. Several old accounts can point at one new one.
- Change at the start of a financial year if you possibly can, so this year and last year stay comparable. The first day of a month is the minimum.
- Archive the old accounts rather than deleting them, so last year's reports still open.
- Update the mapping in your POS and your purchasing system on the same day. Otherwise the first night's sales land in an account that no longer exists.
- Tell your accountant before you start, not after. They'll have opinions, and some of them will save you a weekend.

Where Tableview fits, and where it does not
Tableview keeps the books on the same platform that runs the floor. Revenue posts from the restaurant POS to the ledger automatically, and every card transaction reconciles with the accounts by payment method, so the clearing account check from step three isn't a spreadsheet job. Expenses are categorised by type as they come in, with receipt scanning and templates for recurring costs such as rent and software.
On the purchasing side, supplier invoices are matched against purchase orders and any discrepancy is flagged before it's paid, with ageing reports for what's still owed. Stock is counted in stock management on the same platform, which gives your bookkeeper the closing figure for month end without a clipboard. Reports cover the P&L, balance sheet and cash flow, daily, weekly or monthly, filtered by date range and location, and several sites consolidate into one view. When the accountant needs the numbers, there's a tax-ready export, including to Xero and QuickBooks.
Where something else is the better choice:
- If your Steuerberater or expert-comptable keeps the statutory books in their own package and wants it to stay that way, Tableview becomes the source of your sales and purchase data rather than the books of record. Agree on the export format with them first.
- Tableview doesn't file tax returns and doesn't replace an accountant who knows your country's rules.
- A group with hundreds of sites running its finance on an ERP is better served by tools built around that ERP.
Key takeaways
- A restaurant chart of accounts is the numbered list of accounts your books use, and it decides how much detail any report can ever show.
- Split sales by menu category and give each one a matching cost account, so food and drink percentages can be read separately.
- Tips, service charges, gift cards, deposits and VAT are liabilities, not revenue.
- Book sales gross and show card fees and delivery commission as expenses.
- Keep one chart for every site and tag transactions by location instead of copying accounts.
- In Germany, France and Spain, build your categories as sub-accounts under the national chart.
Read next: reading a restaurant P&L for what the chart produces, choosing accounting software for where it lives, and restaurant cash flow for the money the P&L doesn't show.