
Menu pricing is the single highest-leverage decision an independent restaurant makes in any given quarter, and almost every operator gets to it last. Inventory gets a weekly review. Labour gets a daily review. Reviews get a Monday-morning huddle. The prices on the menu get a quick look once a year, usually when a printer's deadline forces the issue, and the decision is made on the back of a napkin in 20 minutes. That gap between the importance of the decision and the time spent on it is where most of the unrealised profit in casual and fine dining sits in 2026.
This guide is the operator's playbook for closing that gap on purpose. It covers the four pricing methods that actually work together (not the cargo-cult version where each one is taught in isolation), how to set the cost-plus floor without slipping into the common food-cost mistakes, how to lift prices on the items that can take it without losing covers, the price-ending and decoy tactics that move basket size, and a free Menu Price Recommender embedded mid-article that lets you test a single dish against all four methods in under 30 seconds. By the end you should be able to sit down with your menu PDF tonight and identify the three to five items where a 5-10% lift is currently sitting on the table, and the one or two where you have over-reached and are quietly suppressing volume.
Why pricing is the highest-leverage lever on the P&L
Take a typical full-service independent doing $1.6M in annual revenue with a 30% food cost, 32% labour cost, 30% other operating expenses and an 8% net margin. The owner-operator wakes up wanting to add a point of margin and reaches for the usual three levers. Cutting one point of food cost (from 30% to 29%) is roughly a two- to three-week project of supplier renegotiation, recipe re-spec and waste tightening, and lands about $16,000 of incremental EBITDA in a full year. Cutting one point of labour cost is a much harder fight with real risk to service quality and another $16,000. A 1% blended menu price increase, absorbed by guests with the elasticity most casual restaurants actually show (roughly -0.4 to -0.6 in healthy markets, i.e. each 1% price lift loses 0.4-0.6% of covers), drops about $13,000-$14,000 straight to the bottom line in the same year - with no supplier negotiation, no payroll conversation, no back-of-house disruption. And unlike the cost-side levers, pricing compounds: the new prices stay in effect next year and the year after.
The reason almost every operator under-invests in pricing is that the consequences of a bad price are visible (a guest grumbling about the bill, a Yelp comment about value) while the consequences of a chronically under-priced menu are invisible (the EBITDA that never shows up on the P&L). The visible cost feels avoidable, the invisible cost does not feel like a cost at all, so the conservative default is to leave prices alone. That conservative default is exactly why most independents quietly subsidise their guests by $30,000-$80,000 a year in foregone margin without realising it.
The other reason pricing is the highest-leverage lever is its interaction with everything else on the P&L statement. Raising a price by 1% raises food cost by 0% (the plate cost is the same in dollars), drops the food cost percentage, increases gross margin per cover, increases contribution per labour hour, shortens the time to break-even on the fixed-cost base, and improves the unit economics that drive financing decisions. No other operational change touches that many lines on the P&L from a single decision.
The four pricing methods - what each gets right and wrong
Most pricing advice picks one of the four classic methods and sells it as the single right answer. In practice the four methods each answer a different question, and the operator's job is to sequence them, not to choose one. The four are cost-plus, value-based, competition-based and psychological pricing.
Cost-plus pricing answers the question "what is the floor below which I lose money on this dish?" It is the foundation, but it is only the foundation: a menu built purely from cost-plus will systematically under-price differentiated items (the ones with the highest willingness-to-pay) and over-price commodity items (the ones with the most competitive pressure). Cost-plus alone leaves the largest margin on the table on the dishes that should be your profit drivers.
Value-based pricing answers the question "what will the guest happily pay for this specific dish given how differentiated it is?" Value-based pricing captures the willingness- to-pay surplus that cost-plus misses, but it requires the operator to make a defensible judgement about how differentiated each dish really is. Used alone, value-based pricing drifts into wishful thinking: every operator believes their signature dish is unique; the price test usually disagrees.
Competition-based pricing answers the question "where am I positioned in the local consideration set?" The comp anchor matters because the modal guest reads three or four menus before walking in, and the relative price across the set drives the choice more than the absolute price. Used alone, competition-based pricing turns the operator into a follower who never tests the upper bound of what the market will bear.
Psychological pricing answers the question "for the price I have decided on, what is the exact display that maximises perceived value?" It is the last 10% of the work and it covers price endings, decoy items, anchor items, price grids and display order on the menu. Psychological pricing alone is manipulative noise; layered on a defensible cost-plus / value / competition trio it adds another 2-4% of margin without changing the underlying price strategy.
The correct sequence is cost-plus first to find the floor, then value-based to identify where you can lift above the floor, then competition-based to sanity-check against the local set, then psychological to design the final display. Skip the first three and do only psychological tricks and you get the menu engineering equivalent of putting lipstick on a structurally broken menu.
Cost-plus done right - the formula, the inputs, the gotchas
The cost-plus formula is one line. Plate price = plate food cost divided by target food cost percentage. A salmon plate that costs you $5.60 in ingredients, with a 28% target food cost, sets a cost-plus floor of $20.00. Anything below $20 either misses the food-cost target or eats into the labour / overhead margin needed to make the rest of the business work. The simplicity of the formula is what makes it powerful, and the discipline of running every dish through it on every reprint is what separates operators who hit their food cost percentage target from operators who chase it for years and never catch it.
Three inputs determine the floor: the plate cost (what the ingredients actually cost you to put on the plate), the target food cost percentage (the operator-level decision about how much of revenue you want food to consume), and the cost of complexity (the hidden labour cost that varies by dish but does not show up in ingredient cost). The first input is the one most operators get wrong, almost always by undercounting.
A correctly costed plate includes: the AS-SERVED weight of every ingredient (not the AS-PURCHASED weight - a 6 oz salmon portion served from a 7 oz raw fillet has 14% trim and yield loss baked in, which is real food cost), the proportional cost of garnishes and sauces (often 8-15% of plate cost and almost always undercounted), the per-portion cost of cooking oil and seasoning consumables (a forgotten 2-4% on fried and sauteed dishes), the per-portion cost of plate-side accompaniments included in the price (bread service, butter, complimentary items - they are not free, they are folded into the cost of the dishes they accompany), and a 1-2% line for the inevitable kitchen waste on that specific dish category. A plate cost calculated on raw ingredient prices alone typically under-counts the true cost by 15-25%, which means the cost-plus floor it produces is 15-25% too low, which is exactly the gap that turns "I run a 28% food cost target" into "I close my year at 33% and cannot figure out why."
The second input - the target food cost percentage - is an operator-level strategic decision, not a market constant. The target should reflect your service model, your labour cost, your rent burden and your concept positioning. The healthy bands for 2026 are roughly:
- Quick-service (QSR): 28-32% food cost. The high-volume / low-labour model can carry a higher food cost because labour percentage is lower; the floor is rarely the binding constraint.
- Fast-casual: 28-32% food cost. Similar to QSR but with slightly more plate complexity; the upper end is normal for protein-heavy concepts.
- Casual full-service (independent): 28-32% food cost. Wider variance depending on bar mix; restaurants with strong bar contribution can sustain a higher food cost than dry-dining peers.
- Polished casual / upscale casual: 30-35% food cost. The plate complexity and ingredient quality justify a higher food cost; the price band absorbs it.
- Fine dining: 32-38% food cost. The premium ingredient cost and the small portion of revenue that is bar mean food cost can run higher; the labour ratio compensates.
- Pizza / specialty single-format: 26-30% food cost. The format-driven economics favour a lower food cost target.
- Bar / drink-led venues: 24-28% food cost on the kitchen, balanced with a much lower pour cost on the drink side (typically 18-22%).
Pick the band your concept actually fits, not the one you wish it fit. A casual full-service venue with a 26% food cost target will price itself out of the local consideration set; the same venue with a 35% food cost target will not generate enough gross margin to cover its labour and overhead. The prime cost target (food + labour together) is the more useful constraint to hold the food cost target against: most healthy independents land prime cost in the 55-62% band, and the food / labour split inside that envelope is a function of service model.
The third input - kitchen complexity - is where cost-plus pricing done well separates from cost-plus pricing done lazily. A dish that takes 90 seconds of cook line attention and a dish that takes 12 minutes both look identical in the ingredient ledger; the cost-plus formula treats them as the same. They are not the same. The 12-minute dish consumes seven times more kitchen labour per cover, and that labour either has to be priced in or it shows up as a labour-cost overrun on busy services. The cleanest way to handle this in a small operation is to nudge the cost-plus floor upward by 5-10% for "Standard" complexity dishes and 10-15% for "Complex" dishes. The Menu Price Recommender below folds the complexity nudge in automatically so you do not have to do the arithmetic by hand.
Value-based pricing - charging the premium your differentiation earns
Cost-plus sets the floor; value-based pricing sets the realistic ceiling. The mechanism is straightforward: a guest's willingness to pay for a dish is determined by how differentiated they perceive it to be from the alternatives in their consideration set, not by what it costs you to make. Two dishes with the same plate cost can earn very different prices because the guest sees one as a commodity ("everyone serves this") and the other as a signature ("only this place does this version well"). The value tier you can credibly claim is the multiplier you can layer on top of the cost-plus floor without losing covers.
The three tiers operators can think in are Commodity, Differentiated and Signature.
Commodity covers items where the guest's reference price is set by a familiar cross-restaurant version of the same dish (margherita pizza, classic Caesar salad, grilled chicken sandwich, basic pasta marinara, garden burger, fries). The guest knows roughly what these cost in your market and reads a 20% premium as overpriced regardless of your execution. The correct pricing move for commodity items is to price them at the local median, no premium, and use them as the basket-stretching "safe" choices that anchor the menu but do not drive margin.
Differentiated covers items where your execution is meaningfully better than the median (better sourcing, better technique, distinctive recipe, a presentation worth photographing) but the dish is still recognisable. A 10-15% premium over the local median is defensible if the menu copy, the ingredient callouts and the plating support the lift. Most operators are already doing differentiated execution on half a dozen of their dishes; the missed opportunity is the menu copy that fails to signal it, leaving the price at commodity levels while the kitchen carries the cost of differentiated execution.
Signature covers the items that are genuinely only-here: the chef's signature dish, the seasonal specialty designed around a relationship with a specific supplier, the 20-year recipe the regulars are loyal to, the dish that gets photographed and tagged on social. A 25-40% premium over the commodity reference is defensible because the dish has no real alternative in the local set. The most expensive mistake on this tier is under-pricing: a signature dish at a 10% premium leaves real margin on the table because the guest expected and was prepared to pay 30%.
The pricing test for any value-tier claim is the rolling re-order rate. A genuinely Signature item gets ordered by a high percentage of tables, gets re-ordered by returning guests at a higher rate than commodity items, and is referenced in reviews and social. If you have claimed Signature on a dish and the data does not show those three patterns after a quarter, the dish is Differentiated at best - and you should reprice it down a tier before the menu re-engineers itself by attrition. The menu engineering discipline is the structured way to do this attribution: pricing decides the price level, menu engineering decides which dishes deserve which tier in the first place. The two work together; they are not the same exercise.
Competition-based pricing - using comp anchors without becoming a follower
The modal independent restaurant guest in 2026 looks at three to four menus before deciding where to eat, on a phone, in the 15 minutes between leaving work and the partner asking "where do you want to go." That selection set is the operative competitive context for pricing, not the abstract "market." The competitive question is not "what is the average price of grilled salmon in this city" - it is "what are the four restaurants this guest is choosing between charging for the closest equivalent dish, and how do my prices read against that set."
The mechanical work is to identify your real competitive set (usually four to six restaurants serving a similar cuisine and price band within 15 minutes of you), pull their menus quarterly, and build a comp grid: for each of your top 15-20 menu items, what is the closest equivalent dish at each competitor, what do they charge, what is the median, and where do you sit relative to that median. The grid takes a few hours per quarter and is the single highest-ROI piece of pricing intelligence most independents do not maintain.
The pricing decision the grid drives is not "match the median." The decision is "where am I deliberately positioning above, at, and below the median, and is that positioning consistent with the rest of the concept." A useful default for a value-led full-service independent is to deliberately anchor 5-10% above the median on Signature items (the premium is the price of the differentiation), within ±5% on Differentiated items (you blend with the set so guests do not notice price as the deciding factor), and 5-10% below the median on Commodity items (so the menu reads as fair value when guests scan the basket-stretching items first). The opposite positioning - cheaper on signatures, premium on commodities - trains guests to read your menu as inverted and erodes the value perception even when the absolute basket totals work out the same.
Two anti-patterns to avoid. The first is matching every competitor move; the second is ignoring every competitor move. The correct frequency is a quarterly comp pull with structured decisions on a 12-week horizon, not weekly reactive moves and not ignoring a six-month competitive shift. Operators who reprice defensively every time a competitor cuts a price end up in a race to the bottom; operators who never reprice end up with a menu that reads as 15% expensive against a set that has gradually shifted prices in a year of input inflation.
Psychological pricing - the last 10% that adds 2-4 points of margin
Once you have set the price defensibly, the display of the price on the menu can add or subtract another 2-4 points of contribution through a handful of well-tested levers. The biggest four are price endings, anchor items, decoy items and price grid design.
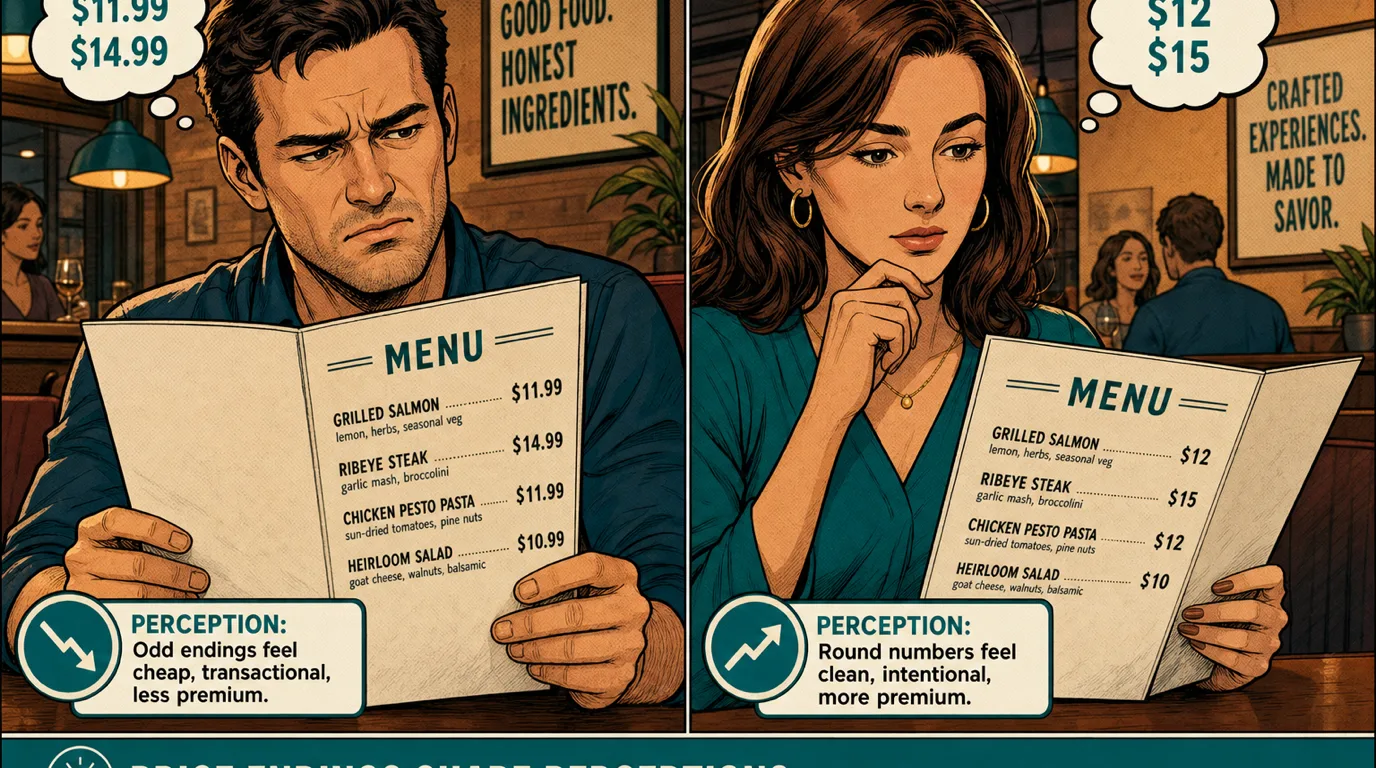
Price endings signal positioning more than they optimise basket math. The convention diners have learned over the last 30 years is that .99 endings signal value (the supermarket, the QSR), .95 endings signal "considered" (the casual restaurant that has thought about prices but is approachable), .50 endings signal premium (the upscale casual venue), and flat round numbers signal fine dining (the price is part of the experience, not a price point). Operators routinely mismatch the ending to the format - running .99 endings on a polished casual menu, or flat round numbers at a budget concept - and pay a small but real perception tax for the mismatch. The Menu Price Recommender below applies the format-correct ending automatically.
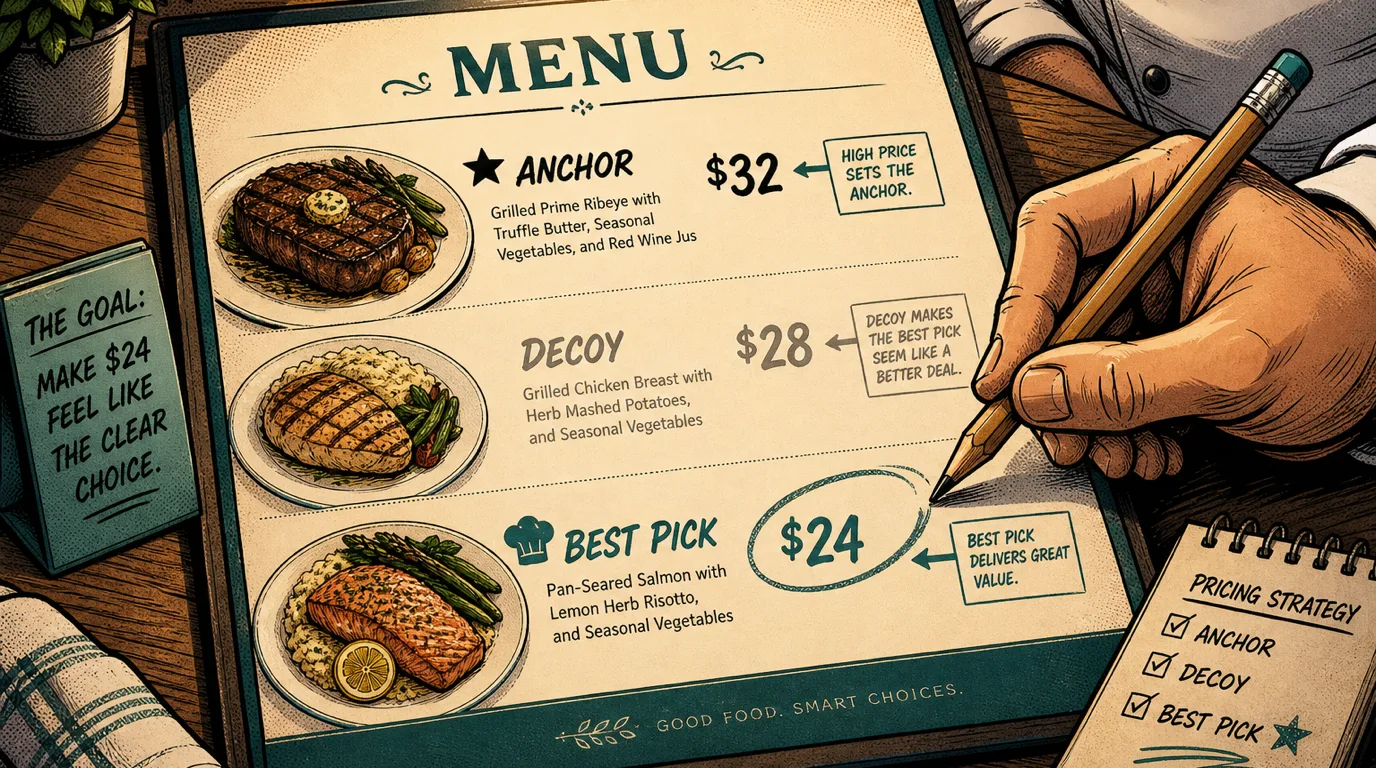
Anchor items are the highest-priced item in each menu category. Their job is not to sell (they typically do sell, but at low volume); their job is to set the upper bound of the category and make the second-most-expensive item feel like a better deal. A steakhouse with a $90 prime ribeye anchor sells more $65 strip steaks than the same steakhouse without the anchor, because the strip reads as the smart-middle choice. The mechanical move is to deliberately include one item in each category that is 20-30% above the category median, even if you expect it to be a low-volume item, because its presence shifts the entire category upward.
Decoy items are deliberately less attractive versions of an item, priced to make a target item look obviously better. The classic decoy in fine dining is the small tasting menu at $95 next to the chef's tasting menu at $110: the $15 premium gets you twice the courses, so the chef's menu reads as the obvious value choice, even though the operator is happy with either sale and prefers the higher one. Decoys work best when the price gap is small and the value gap is large; they fail when the decoy is too obviously a decoy (which the modern guest reads and distrusts).
Price grid design covers the visual layout of the price column itself. The two patterns that quietly destroy basket size are the right-aligned price column (the guest scans the prices first, then the descriptions, and chooses cheapest) and the dotted leader line connecting the dish name to the price (the visual cue trains the guest to read price as a deciding factor). The two patterns that quietly increase basket size are the price-after-description inline format (no column at all, the price sits at the end of the descriptive paragraph in the same font) and the no-currency-symbol format (just "18" instead of "$18.00", because the currency symbol activates spend-anxiety in the prefrontal cortex). Most QR menu platforms now support both patterns natively, and the migration from print is the natural opportunity to switch.
One last psychological pricing lever worth naming: the order in which dishes appear within each category. The first and last positions are the high-attention positions; the middle is where attention drops off. Place your highest-margin item first, the anchor or signature item second, the workhorse items in the middle positions, and a strong second-margin choice at the end. The default order most menus arrive in - alphabetical or ingredient-grouped - is a passive choice that leaves margin on the table.
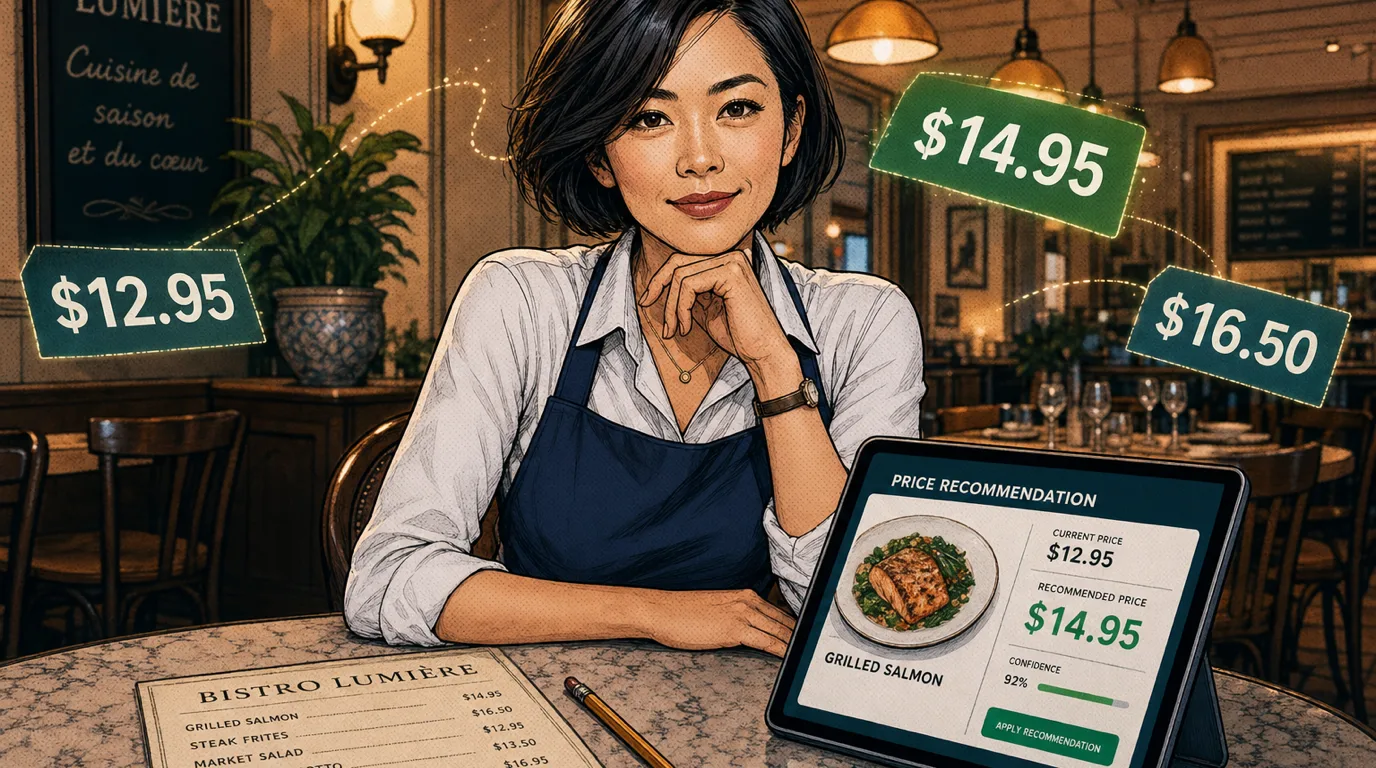
Test a single dish in 30 seconds with the Menu Price Recommender
The calculator below lets you take one menu item and run the cost-plus / value / competition / psychological stack on it in under 30 seconds. Enter the plate food cost (the all-in cost we discussed in the cost-plus section, not just raw ingredient cost), your target food cost percentage, the kitchen complexity tier, the perceived value tier you can credibly defend, the market band your concept sits in, and optionally the closest competitor's price for the equivalent dish. The output gives you the cost-plus floor (do not price below this), the value-adjusted price (the realistic ceiling), the format-correct recommended price with the right ending, the effective food cost percentage at the recommended price, the contribution margin per plate, and a tier badge that tells you whether you are sitting under-priced, on-market or premium relative to the comp anchor (or relative to your target food cost when no comp is entered).
The calculator is the same engine that powers the dedicated Menu Price Recommender page in Tableview's free restaurant calculators hub - the hub also covers food cost, P&L, break-even, pour cost, customer lifetime value and a dozen others. Operators usually run this calculator on their three to five highest-revenue items first, find one or two that are sitting 5-15% under-priced, lift them on the next reprint, and see the impact on the monthly P&L within a quarter.
Pricing across menu categories - different rules per section
The four-method stack above is the framework; each category inside a typical menu has its own twist on how the framework applies. The five categories worth treating distinctly are appetisers, mains, desserts, sides and drinks.
Appetisers are the category most operators under-price. The guest's reference price for a shareable starter is loose (there is no standard "starter price"), the perceived value tier is easy to push to Differentiated because plating and presentation carry more weight on a smaller plate, and the incremental food cost on a starter is typically lower than the menu average. The result: starters can comfortably run a 3-5 point lower food cost than the menu average without resistance, and that margin uplift attaches to roughly two-thirds of all tables. A 12-15% lift in starter prices on the next reprint is the single most common move that produces measurable margin in the next quarter without losing covers.
Mains are the category where the framework runs most strictly. The cost-plus floor is binding (the largest plate cost lives here), the comp grid is most actively scanned by guests (this is what they compare across menus), the value-tier distinction is most visible (the signature versus commodity distinction lives here), and the psychological pricing levers are most impactful. Mains should be priced with the full stack run on each item; the temptation to apply a flat percentage to the whole category is the most common shortcut that produces a structurally under-priced menu.
Desserts are the category where psychological pricing produces the most disproportionate impact. The guest's decision at dessert is not a price decision (the bill is already written in their head), it is an indulgence decision - and the small price gap between desserts barely registers. The pricing move is to anchor the high end of the dessert category aggressively (a $14 indulgent option creates the room for $10 standard desserts to feel reasonable), keep the standard desserts in the .50 or .95 ending convention, and avoid the cardinal sin of running desserts at the same per-plate margin percentage as mains (the absolute dollar contribution at dessert is small enough that you can afford a higher food cost percentage and still drive incremental contribution). A 10-15% lift on dessert prices on the next reprint almost always works through with zero pushback.
Sides are the lowest-attention category and the most quietly under-priced. The guest reads sides as "add-on" rather than as a decision; the price elasticity here is the lowest on the entire menu. A side that costs $0.80 to plate can comfortably sit at $7-9 with no resistance in a casual full-service context; the same side at $5 is leaving $2-4 per cover on the table and is read by guests as suspicious cheap rather than as good value. The default rule for sides is to price them at 20-25% food cost (much lower than the menu average), use them as the basket-stretcher that lifts cover average without changing the main item decision, and never bundle them with a main at a discount unless the bundle math has been run carefully.
Drinks follow their own framework. Wine pricing in 2026 is best handled with a hybrid markup-and-margin approach (2.5-3x markup on bottles under $30 wholesale, a fixed dollar margin of $30-40 on bottles $30-60 wholesale, and a smaller percentage markup on premium bottles to keep the absolute price accessible). Beer follows a per-pour pour cost target (typically 18-22% on tap, 22-28% on bottles), and cocktails follow a standard pour cost target with the labour cost of complex cocktails priced in as a +$1-2 lift for technique-heavy drinks. The drink-side pricing decisions interact with the kitchen pricing decisions more than most operators model: a guest comparing two restaurants will often anchor on the wine and cocktail prices because those are easier to compare than dish-by-dish menu comparisons.
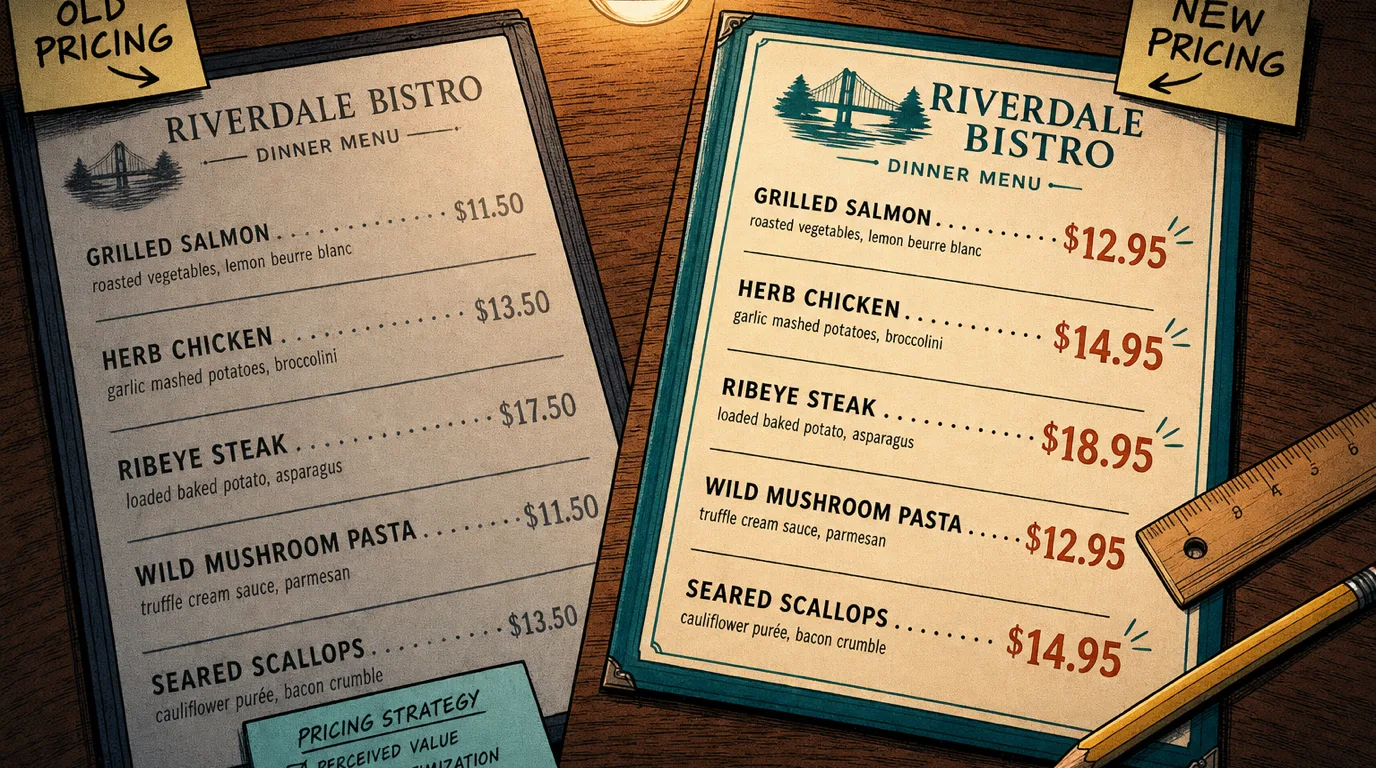
When and how to raise prices - the 12-month repricing playbook
Most independents reprice their menu once a year, with one big reprint that lifts everything by some round percentage to absorb the year of input inflation. That cadence is exactly wrong on two counts. It is too infrequent on the items that need more attention (commodity inputs move in months, not years), and it is too crude on the items that should be moving on a different cycle (signature items get repriced when the value perception shifts, which is its own clock).
The cadence that produces the best operator outcomes in 2026 is a quarterly mini-reprice on 10-15% of the menu, plus an annual full-menu refresh. The quarterly mini-reprice focuses on the items where the cost has moved most (the supplier price index for that ingredient class has shifted), the items where comp moves justify action (a competitor has shifted their price by more than 5% on the equivalent dish), and the items where the rolling sales data shows a clear under- or over-pricing signal (sustained high re-order rate at the current price is the under-pricing signal; sustained falling order rate after a previous lift is the over-pricing signal). The annual full-menu refresh is the opportunity to redesign the menu visually, refresh the menu copy, re-photograph the dishes that have changed, and reset the psychological pricing layer (price endings, anchors, decoys, order). The two cadences run in parallel; the quarterly is operational, the annual is strategic.
The mechanics of a price lift that does not lose covers come down to four habits. Lift in waves, not in single jumps. A 4% lift announced and applied to the whole menu is read as a price increase; the same 4% lift split into two 2% waves a quarter apart with the second wave timed to a menu copy refresh is invisible. Lift the items that can take it most, not the items that can take it least. The instinct to "spread the pain" across the menu is exactly wrong; concentrate the lift on Signature and Differentiated items where the value perception carries it, and leave Commodity items at the comp median. Refresh the menu copy with the lift. A price lift attached to a stronger description ("dry-aged 28-day ribeye, locally sourced, with bone marrow butter") reads as the price catching up to the value; the same lift on the same dish with the same old description reads as price inflation. Brief the front of house before the lift goes live. The single highest source of guest pushback on a price lift is the server who answers a question about the new price with an awkward "yeah, we had to raise it" - the same lift paired with a 30-second briefing on what changed (better sourcing, a new technique, a refreshed recipe) turns the conversation into a feature, not an apology.
One specific lift worth calling out: the third-party delivery price decision. Most independents under-price their third-party delivery menu by failing to apply a 10-15% delivery markup to absorb the marketplace commission. The Marketplace Margin Calculator shows the per-order economics of the delivery channel; the pricing decision that comes out of that calculator is usually a 10-15% marketplace-specific markup with the same items priced at native prices on the first-party online ordering channel. The same dish has two prices, one for each channel; the guest does not see both, and the margin uplift on the delivery channel is what keeps that channel from quietly hollowing out the P&L.
Six common pricing mistakes that cost real margin
The six pricing mistakes that recur most often in operator P&L reviews are worth naming explicitly so they are easy to spot in your own menu.
1. Pricing only on raw ingredient cost. The forgotten plate-cost line items (yield loss, garnishes, sauces, seasoning, oil, plate-side accompaniments, kitchen waste) cumulatively under-count plate cost by 15-25%, which flows into a cost-plus floor that is 15-25% too low. The fix is the discipline of costing plates on AS-SERVED cost with every consumable line included.
2. Flat-percentage menu-wide repricing. Adding 4% to every dish on the next reprint feels fair but produces a chronically suboptimal menu: commodity items end up 4% above the comp median (and lose covers), signature items end up 4% under- priced (and leave margin). The fix is item-by-item repricing on the items that need it, not flat lifts.
3. Under-pricing signature items. Operators systematically charge 10-15% less than they could for the dishes guests come back specifically for. The fix is the value-tier discipline above and the re-order data check: if a signature dish has a high re-order rate and is referenced in reviews, it is under-priced.
4. Cargo-cult price endings. Running .99 endings on a polished casual menu because "supermarkets use them" mis-signals the format and costs perceived value. The fix is the format-correct ending convention above: .95 for casual, .50 for premium, flat round for fine dining.
5. Not pricing the delivery channel separately. Operating a single menu price for both first-party and marketplace channels gives the marketplace its 25-30% commission out of your margin. The fix is a 10-15% marketplace-specific lift, transparent to the guest on the platform side and invisible on the dine-in side.
6. Repricing once a year on a printer's deadline. The annual reprint is a backwards forcing function; the menu should be reviewed quarterly and refreshed annually. The fix is the two-cadence rhythm above: quarterly mini-reprice on 10-15% of items, annual full refresh.
Pricing and menu engineering - related disciplines, not the same thing
Pricing decides the price level on each item. Menu engineering decides which items deserve to be on the menu at all, in what position, with what visual emphasis. The two disciplines pair, and the operator who does both well outperforms the operator who does either one in isolation.
The menu engineering matrix sorts every dish into one of four quadrants based on profitability and popularity: Stars (high margin, high volume - the heroes, keep and promote), Workhorses (low margin, high volume - the volume drivers, look for ways to bump the margin without losing volume), Puzzles (high margin, low volume - the under-recognised winners, reposition on the menu and improve the copy), and Dogs (low margin, low volume - cut from the menu unless they serve a strategic role like allergen coverage).
Pricing is what moves a Workhorse toward Star (a careful price lift on a high-volume item, layered on better copy, can convert the quadrant); pricing is also what rescues a Puzzle (the dish was priced too high for the value perception - a price reduction can shift it into Star territory). The menu engineering exercise tells you where to focus the pricing exercise; the pricing exercise gives you the lever for the moves the menu engineering matrix suggests. Run menu engineering quarterly to find the moves; run the pricing playbook above to execute them. That is the full discipline.
The third leg of the stool is the menu management system that lets you actually change prices fast across all your sales channels. A repricing decision that takes three weeks to propagate across the printed menu, the QR menu, the first-party online ordering site and the third-party marketplaces is a decision that will not get made often enough. A POS-linked menu where a price change updates everywhere in real time turns the quarterly mini- reprice from a project into a 15-minute task. Tableview's POS and e-menu products are designed to be the single source of truth for menu prices across every channel, so the operator only has to make the pricing decision once.
The bottom line and what to do this week
Menu pricing in 2026 is not the once-a-year reprint decision most operators treat it as; it is the highest-leverage lever on the P&L and it deserves a quarterly operating rhythm. The four-method stack (cost-plus floor, value-tier ceiling, competition sanity check, psychological display) gives you a defensible price for any dish in under five minutes. The Menu Price Recommender above is the single-dish tool; the Food Cost Calculator, P&L statement, break-even calculator, pour cost calculator and customer lifetime value calculator extend the same discipline to the rest of the operator workflow.
The three things to do this week. Cost five plates properly. Pick your top five revenue dishes, calculate the true AS-SERVED plate cost with garnishes, sauces, yield loss and the full consumable line, and compare to the price you are charging. The cost-plus floor is plate cost divided by your target food cost; if the current price is below the floor, you have a margin emergency. If the current price is 10-15% above the floor on a Signature item, you have room to lift. Build a comp grid. Pull menus from your four to six closest competitors, build the comp table for your top 15 items, and identify the three items where you are visibly under-priced against the set. Pick three items to lift. On the intersection of the cost analysis and the comp analysis, identify three items where a 5-10% lift is defensible (Signature or Differentiated, currently under-priced versus comp, with a stable or rising re-order rate). Reprice those three items on your next menu update, refresh the copy on the same items, brief your front of house, and measure the result over the next eight weeks. That single pass usually surfaces $15,000-$35,000 of annualised margin for a typical independent. The restaurant improvement ideas companion playbook covers the adjacent operational moves that compound with the pricing moves above; the 2026 restaurant industry trends piece sets the macro context the pricing decisions are made against. Together the three pieces are the start of the operating system for a higher-margin 2027.