
Most operators can quote their food cost percentage from the last P&L flash report without checking. Ask the same operator what their pour cost is on a Tito's vodka soda or on a six-ounce glass of the house pinot, and you get a pause. The pause matters. Beverage carries the highest margin in the building - sometimes twice the contribution of the food menu - and the part of beverage that operators leave on the table every week is rarely a pricing problem. It is a pour discipline problem, a portion problem, a free-pour bartender problem, and almost always a weekly inventory problem. Operators who run their bar against a real pour cost number close better quarters than operators who guess.
This guide walks through what pour cost actually is, the healthy bands by category (spirits, wine, beer, non-alcoholic), the five mistakes that quietly bloat the number, how to run a pour cost program week to week, and the Monday-morning rhythm that holds the discipline. There is an interactive pour cost calculator embedded a few sections down so you can model your own drinks as you read. The standalone version lives at the calculators hub if you want to bookmark it for the next time you cost a new cocktail.
Pour cost, defined - and why the formula is deceptively simple
Pour cost is the cost of the liquid you serve divided by the price the guest pays. For a single drink the math is one line:
Pour cost % = (Cost per pour) / (Menu price) × 100
Take a Tito's vodka soda. A 1L bottle of Tito's lands at $24 delivered. The recipe is 1.75oz of vodka (52ml) plus soda water and a lime. A 1L bottle gives roughly 19 pours of 1.75oz. The cost per pour on the spirit alone is $24 / 19 = $1.26. The soda water and lime add maybe $0.20. Total cost per drink: $1.46. Menu price: $12. Pour cost = $1.46 / $12 = 12.2%. That is a healthy number for a high-velocity spirit-soda - the contribution per drink is $10.54.
Now take a six-ounce glass of the house pinot grigio. A 750ml bottle wholesales for $14. A 750ml bottle gives 4.2 pours of 6oz (once you account for the realistic over-pour of 0.2oz that every bar takes). Cost per pour: $14 / 4.2 = $3.33. Menu price: $12. Pour cost = $3.33 / $12 = 27.8%. That is also a healthy wine-by-the-glass number, but the contribution per glass is $8.67 - about 18% less than the vodka soda even though the menu price is identical. This is why the healthy band is not one number; it varies by category, and any operator running every drink against a single 20% target is mispricing half their menu.
The four healthy bands by category
Pour cost % bands are operator-tested, format-aware, and based on the realities of how each category sources, stores, and pours.
- Spirits and spirit-forward cocktails: 18-22%. This is the highest-margin category in the bar. Anything under 18% is either an excellent buy or a portion that is too small for the price; anything over 22% is usually either a free-pour problem or a mispriced premium spirit that needs a price reset. Cocktails carry more modifier cost (juice, syrup, garnish) so they should sit slightly above straight spirits within this band.
- Wine by the glass: 22-28%. Wine carries higher cost per pour and lower turnover than spirits, but list prices have to stay competitive with what guests can buy on a wine app at the table next door. Operators who chase a 20% wine pour cost end up with wine prices the market punishes; operators above 28% are usually under-pricing relative to the bottle list. A common rule of thumb is that the by-the-glass price should land near the wholesale bottle cost, which puts you cleanly in the band on most lists.
- Beer (draft and bottle): 20-25%. Beer has the narrowest pricing window because guests have a strong reference price from the grocery store and the bar next door. Draft is the upside lever here - a 50-liter keg of a decent local IPA gives roughly 105 sixteen-ounce pours, which is leverage no bottle can match. Operators who run draft pour cost above 25% are almost always pouring too much foam (a 16oz glass with 1.5oz of head is silently a 14oz pour at the 16oz price - and somehow also a margin leak).
- Non-alcoholic and modifiers: 12-18%. Soft drinks, juices, mocktails, coffee, tea. Highest contribution category by ratio. Operators routinely under-price this category because the unit cost feels trivial; the right move is to price for contribution, not for cost, especially on craft mocktails where the ingredient story justifies a $9 price point and a 15% pour cost.
Together these four bands roll up to a blended bar pour cost target of 18-24% for most independents, depending on the mix. A neighborhood cocktail bar will skew toward 18-21%; a wine bar will run 24-28%; a craft beer hall will sit around 22-25%. Know your mix before you set the target.
Try it on your own drinks
Drop your container size, container cost, pour size, and menu price into the calculator below. It returns pours per container, cost per pour, pour cost %, contribution margin per drink, and a tier badge that tells you whether you are in the healthy band for that category. Nothing leaves your browser.
If the badge comes back over your target band, do not just raise the price. Walk through the five common mistakes in the next section first - four of the five fix themselves without a menu-print reprint.
Five mistakes that quietly bloat pour cost
Every pour cost audit we have run on an independent bar comes back with at least three of these in motion. Most operators are unaware of any of them.
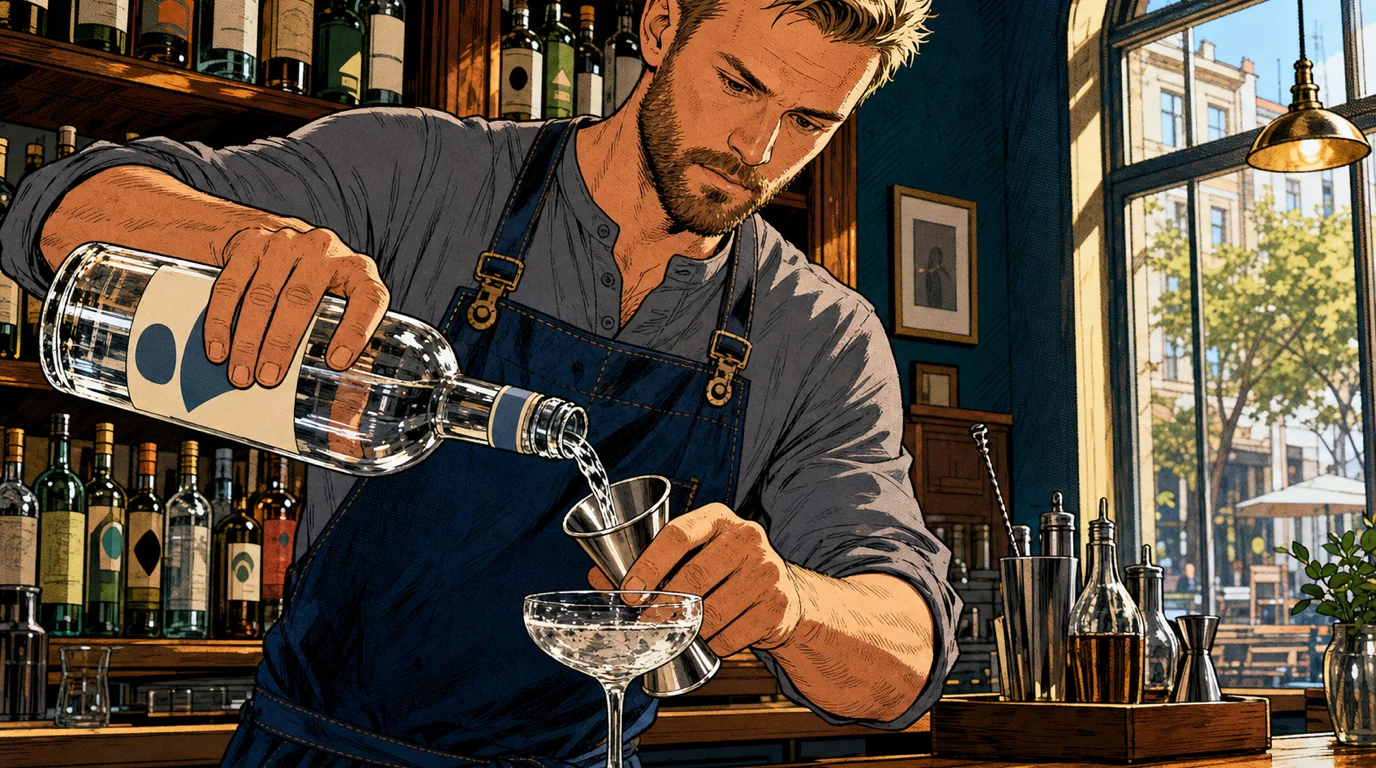
- Free pouring without a count system. A skilled free-pourer is within ±5% of a measured pour on a good night and ±15% on a bad one. A measured pour using a jigger is within ±2% every time. The math: a 1.5oz cocktail recipe poured at 1.75oz on average is a 16.6% over-pour, which on a spirit running $0.85 cost per recipe pour adds about $0.14 of unsold liquid to every drink. At 300 cocktails a week that is $42/week, or roughly $2,200 a year on one recipe. A bar with eight signature cocktails is looking at $17,000+ a year on free pour alone. Buy the jiggers, train the count, audit weekly.
- Foamy draft pours. A 16oz glass with 1.5oz of head is a 14oz pour priced at 16oz. The pour cost is correct on paper (because the keg yield assumes proper pours) but the actual sold ounces undershoot, which shows up as either negative variance (more kegs used than expected) or revenue you never captured (more drinks served than the system thinks). Coach the bartender on a clean two-finger head and clean lines; a foamy keg is usually a line-pressure problem you can fix on Tuesday morning.
- Under-priced premium spirits. Most bars set the premium price by adding a flat dollar amount to the well price ("$5 more for top shelf"). The math falls apart fast: if Don Julio 1942 costs you $9 per pour and the price is $25 (well + $20), you are running 36% pour cost on the most labor-light drink in the building. Premium spirits should be priced by category target, not flat upcharge. Re-cost every premium SKU once a quarter at minimum; SKU-by-SKU re-pricing is the lowest-effort margin move in the bar.
- Theft and over-comping. The hardest one to talk about and the most common. Industry surveys put unrecorded liquor loss at 15-25% of bar volume, split roughly evenly between deliberate theft (drinks for friends, sneaks for the staff after shift, watered-down well bottles), accidental over-pour, and generous comps that go unrecorded. The fix is not to interrogate your team; it is to have a system that makes the variance visible (weekly inventory + perpetual draft pours + comp logs in the POS) and a tone-from-the-top that comping is fine when there is a written reason and not fine when there is not.
- Skipping weekly inventory. The single largest predictor of a high pour cost is how often the bar takes a real inventory. Bars that count weekly run a pour cost about 3 points lower than bars that count monthly, and 6 points lower than bars that count quarterly. The variance lives in two places: the bottles that never made it to the bar (receiving error) and the bottles that left without a corresponding ring (pour discipline). Weekly inventory makes both visible inside a 7-day feedback loop, which is short enough to catch the cause while people still remember the shift.
Running a pour cost program week-to-week
Pour cost is not a once-a-quarter spreadsheet. It is a weekly operating rhythm with a count, a variance read, and a corrective conversation. The pattern that works for most independents:
- Sunday close: the bar manager counts opened bottles to the nearest tenth using a digital scale (or the tenth- of-bottle eyeball if your team has the reps). Closed bottles are counted by case and unit. The inventory system should let you record this on a tablet at the bar; if it does not, buy a different one.
- Monday morning: the POS exports the week's ring data by SKU. The inventory system reconciles starting inventory + purchases - ending inventory against the theoretical usage from sales. The output is a variance dollar amount and a variance percentage by category (spirits, wine, beer, NA).
- Monday afternoon: any category running more than 3% variance gets a 15-minute conversation. Almost always the root cause is one of four things: a recipe spec drift (a bartender's "signature" pour has crept up), a pricing miss (a premium SKU is selling at well price by mistake), a receiving error (the invoice quantity does not match what landed), or a comp-and-void pattern that nobody chased.
- Tuesday-Saturday: the schedule runs against known pour-discipline standards. Jiggers in place, comp policy written and visible behind the bar, premium spirit prices on a laminated card that the team can reference, and a clear "two-finger head" standard for draft. The discipline is held by the same person who built the schedule (see the staff scheduling guide for how that role fits the weekly rhythm).
Setting the right target for your specific bar
A target that ignores your category mix is a target that produces constant variance complaints with no clear root cause. The way to set a target that you can actually hit week after week is to weight the category bands by your sales mix from the last 90 days. Pull beverage sales by category from the POS, multiply each category's share by the midpoint of its healthy band (20% for spirits, 25% for wine, 22.5% for beer, 15% for NA), and sum. That weighted blended number is your target. Most independents land between 19% and 23% depending on mix; chains run leaner because their volume justifies better wholesale terms.
Recheck the target every time the mix shifts by more than 5 points in any category. Adding a tasting menu wine pairing can pull the blended target up by a full point overnight; opening a draft program with twelve handles can pull it down by a point and a half. The happy hour program similarly moves the blended target because the happy-hour pour cost is intentionally higher than the regular menu - if you do not adjust for that in the P&L, the variance read on Monday morning will lie to you.
Pour cost vs beverage cost vs liquor cost
Operators use these terms interchangeably and they should not. Tightening the language is the first step in tightening the number.
- Pour cost is per-drink: the cost of the liquid in a single drink divided by the menu price. This is what the calculator above computes and what your bartender should know when they cost a new cocktail.
- Beverage cost is program-wide: total beverage COGS / total beverage sales for a period. This is what shows up on the P&L statement and what your accountant benchmarks against. Healthy blended beverage cost for most independents lands in the same 18-24% band as the per-drink target, but the rollup depends entirely on your category mix.
- Liquor cost is sometimes used as a synonym for beverage cost and sometimes used to mean spirits-only cost, depending on which side of the bar your operator grew up on. Always clarify before you compare numbers; we have seen two operators disagree by 4 points and discover they were defining the denominator differently.
The relationship is straightforward: per-drink pour cost is the unit-level discipline that drives the program-wide beverage cost that shows up on the P&L. Every dollar of pour-cost discipline at the recipe stage rolls up to about a dollar of bottom-line margin at the month-end close. Beverage cost is, dollar-for-dollar, the most direct pillar-to-P&L leverage in the building.
What your bar inventory system actually needs to do
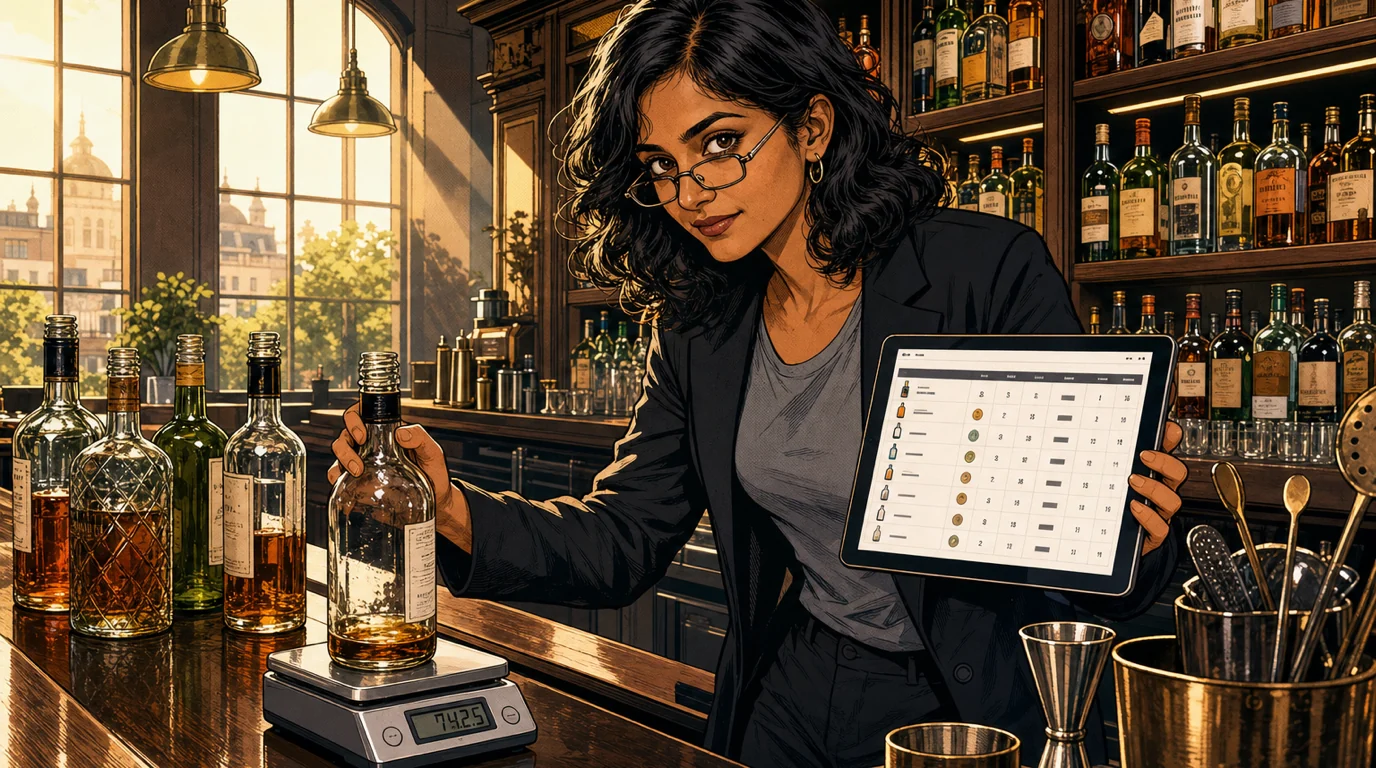
Bar inventory tools span $40/month spreadsheet replacements to $400/month enterprise platforms. Most independents are paying for features they will never use and missing features they actually need. The five capabilities that matter:
- Tenth-of-bottle counting on tablet. The single biggest time-saver. The team should be able to walk the bar with a tablet, tap the SKU, and record "0.4 bottle" in a tap. Anything that requires going back to a back-office computer to enter counts will not get done weekly.
- POS-integrated recipe costing. The system should pull menu prices from the POS automatically and compute pour cost per ring against the recipe spec. If you have to maintain recipe specs in two places (POS for the kitchen-bar pass and inventory for the cost calc) you will eventually stop maintaining one of them.
- Variance flagged by SKU, not category. A category-level variance report tells you spirits are off; a SKU-level report tells you Don Julio is off. Only the second one is actionable. Insist on it before you sign.
- Order generation against par levels. The system should propose the week's order based on usage and par stock, not require the bar manager to rebuild the order from scratch every Monday. This is a 90-minute saving per week.
- Mobile receiving with photo capture. Receiving errors are one of the four root causes of pour-cost variance, and the cheapest way to catch them is a photo of the invoice taken on the bar's tablet at the dock. Any inventory tool that does not let you do this is at least one product generation behind.
For most single-location bars the right price band is $80-$150/month for a tool that does the five things above. Anything more should be justified against a specific operating problem, not a marketing checklist. See the broader restaurant tech stack guide for where bar inventory sits inside the seven-layer architecture.
How beverage margin fits the financial picture

Beverage margin is the single largest lever for closing the prime-cost gap on most independent operations. The arithmetic explains why: a 2-point improvement in food cost percentage on a $1M food program is $20,000 a year. A 2-point improvement in beverage cost on a $400k beverage program is $8,000. But beverage cost is structurally easier to move - the inputs are SKU-level, the recipes are stable, and the variance feedback loop is shorter. Most operators leave beverage on the table because food cost gets all the management attention; the operators who reverse that priority pull ahead.
The metrics interlock cleanly. Per-drink pour cost rolls into program-wide beverage cost, which sits next to food cost in the COGS section of the P&L. COGS plus labor gives you prime cost, which determines whether your revenue clears break-even each month. Menu engineering on the cocktail list (Stars, Plowhorses, Puzzles, Dogs) compounds the gain because every margin point you add to a Star is a margin point on the most-ordered drinks in the building. The whole arc is one system; pour cost is the unit-level lever.
For the calculator suite we now run eight standalone tools that cover the financial and operational rhythm. The pour cost calculator embedded above pairs with the food cost calculator as the COGS-side counterpart, the P&L calculator provides the monthly read, and the break-even calculator tells you the revenue threshold every drink has to defend. Together they cover every weekly and monthly number an independent operator runs.
One last note on tipping out the bar
Pour cost discipline has a quiet relationship with the tip pool. A bar that pours 1.75oz on a 1.5oz recipe is, in effect, giving the guest a 16% bonus drink at the operator's expense, which then gets tipped against by the guest and partially flows back to the bartender via tip-out. The math is unflattering: the bartender who over-pours is being paid extra by you to give your liquor away to your guests, who then tip your bartender more for the over-pour. The fix is not a tip-pool change; it is a pour discipline change that the team understands as a service-quality standard, not a cost-control standard. See the service charge vs tips guide for the wider compensation context, and the barback role guide for how the support layer of the bar absorbs the discipline.
Bottom line
Beverage is the highest-margin category in the building and the one most operators leave underwatched. Set the pour cost target by category, not by single number. Buy the jiggers and train the count. Take inventory weekly to the nearest tenth of a bottle. Re-cost premium spirits quarterly. Make comping legible to the team and hold the variance read on Monday morning. The compound effect of those five moves across twelve months is the difference between a beverage program that funds the next hire and one that does not.
Run the calculator above on the three drinks you sell most. If any of them comes back outside the band for its category, walk through the five mistakes before you reach for a price change. The right pour cost is rarely a pricing problem; it is a discipline problem with a pricing escape hatch.
Read next: Menu Pricing Strategy for Restaurants: The 2026 Operator's Playbook on How to Price Your Menu (with Free Menu Price Recommender) and Food Cost Percentage: The 2026 Restaurant Operator's Guide and Restaurant Prime Cost: How to Calculate and Reduce It in 2026.