
Walk into the back office of any 60-seat independent on a Tuesday morning and you will find the same three things on the desk: a stack of delivery invoices held down by a half-empty coffee mug, a printed weekly inventory sheet with handwritten counts, and an owner who knows almost everything about the menu and almost nothing about why the cost-of-goods line on the P&L moved 2.3 points last month. The recipes have not changed. The portions are tight. The wastage book looks clean. And yet the food-cost percentage keeps drifting upward, quietly eating the operating margin that the owner spent three years building.
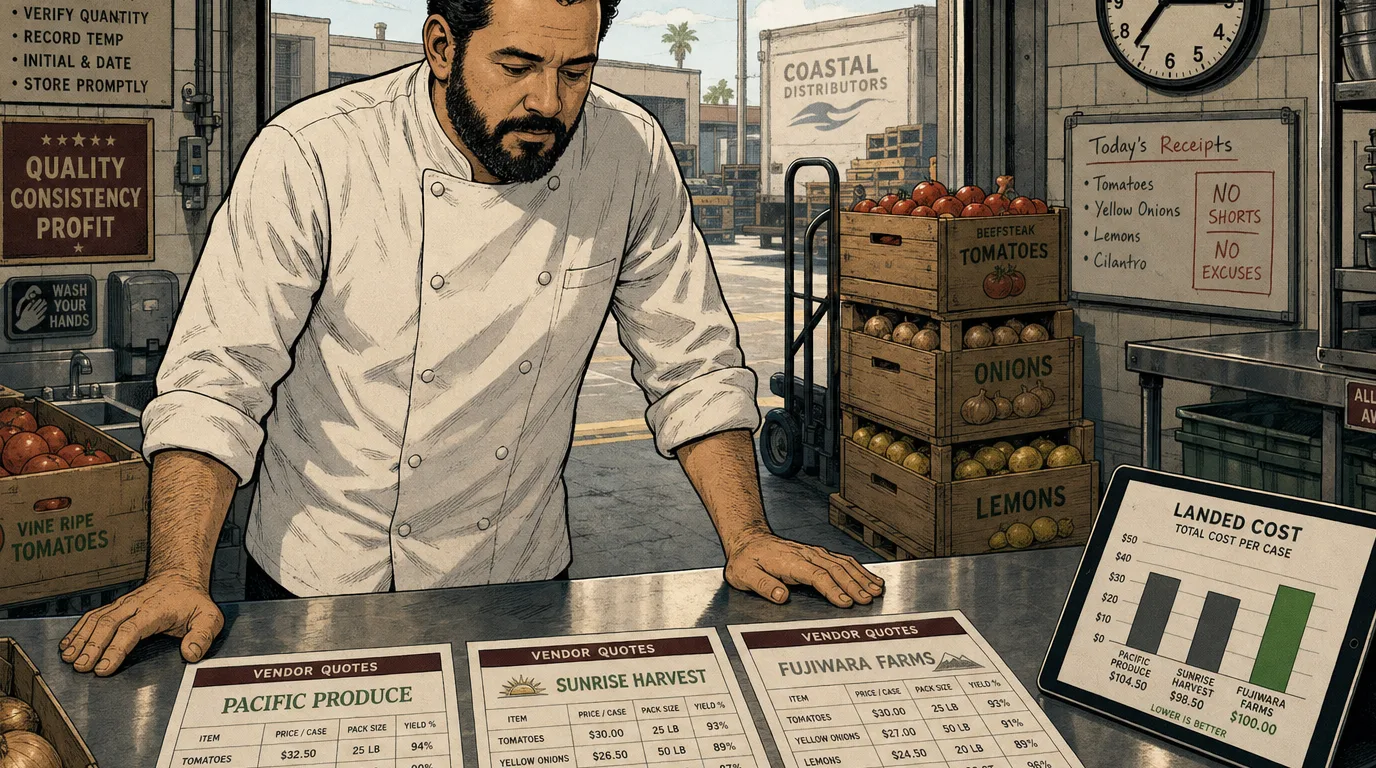
Nine times out of ten the answer is procurement. The single biggest lever in independent-restaurant economics is not the menu price, not the labour schedule, not even portion control, but the discipline of buying smarter from the right suppliers at the right specifications on the right terms. A purpose-built restaurant procurement system turns that lever from a quarterly fire drill into a weekly habit, and that is the difference between watching food cost happen to you and running it. This guide is the operator's playbook for taking back control of the buy: how restaurant procurement actually works in 2026, the seven hidden cost drivers most operators never benchmark, the 90-day RFP process that realistically takes 30-90 basis points out of food cost without losing quality, the contract terms that protect you from the second-quarter price spike, and an embedded Vendor Cost Comparison calculator that turns any three competing supplier quotes into the only number that matters - the true landed cost per usable unit on your plate.
Why procurement is the most under-managed line on your P&L
Independent operators get trained on food cost percentage and labour cost as the twin pillars of prime cost, and they are. The trade press writes about menu pricing, portioning, theoretical food cost variance, and waste reduction relentlessly. What barely gets written about is the line that silently shapes every one of those numbers: the price you pay your suppliers, the pack size you accept, the delivery terms you sign, and the substitutions you tolerate when an item is short. That line moves more margin in a typical year than every recipe re-spec, portion drill and waste-bin audit combined.
The math is straightforward. A casual full-service restaurant doing $1.6M a year in revenue runs roughly $480,000 in food cost at a 30% target. Strip out the 25-30% that comes from non-negotiable inputs (utilities for batch cooks, packaged drinks at fixed wholesale, beverage list with brand mandates) and you are left with about $340,000 of negotiable procurement. A disciplined 90-day procurement reset that pulls landed cost down a realistic 4-6% on that base saves $13,600-$20,400 a year. That is more margin than a one-point food-cost cut would produce on the same revenue. And the savings are clean: no recipe rewrites, no menu reprint, no portion fights with the line, no kitchen friction. You just buy better.
The reason almost every operator under-attends to this line is that procurement looks intimidating from the outside. The vendor catalogue is 60 pages of SKUs with confusing pack sizes. The sales rep is friendly and has been calling on the venue for four years. Switching suppliers feels like a relationship break-up. Counter-quoting feels like distrust. The prevailing wisdom in independent kitchens is that the foodservice distributor universe is opaque, prices are roughly the same everywhere, and the only real choice is which rep you like best. None of that is true, and the operators who run the most disciplined procurement programs are also the ones who keep the warmest supplier relationships, because they treat the supplier set as a managed portfolio rather than a personal loyalty arrangement.
How restaurant procurement actually works in 2026
Restaurant procurement in 2026 is a two-tier system. The first tier is broad-line foodservice distribution, dominated by Sysco, US Foods, Performance Food Group and a long tail of regional players (Reinhart, Shamrock, Cheney Brothers, Ben E. Keith, Gordon Food Service in the Midwest and Canada, Bidfood and Brakes in EMEA). These are the trucks that arrive twice a week with everything from frozen french fries to paper napkins. The second tier is specialty - meat purveyors, produce houses, cheese specialists, seafood wholesalers, craft beer distributors, direct-from-farm cooperatives. The art of running procurement well is choosing which categories belong in the broad-line basket (where price discipline and consistency matter most) and which deserve specialty relationships (where quality, story and flexibility carry the day).
The pricing model the broad-liners use is opaque on purpose. Most catalogue prices are list prices that almost nobody pays. Real prices come from cost-plus arrangements (the distributor's actual cost plus a negotiated markup, typically 8-18% depending on volume and category), contract pricing on a defined list of "stocked" items (the distributor holds inventory and price for 60-90 days), and street pricing on everything else (re-quoted weekly, often weekly-volatile). Most independent operators only see the catalogue price, never ask for cost-plus on volume items, and miss the contract-pricing protection on the SKUs that move the most volume. Those three pricing levers, properly deployed, are worth 2-4% on the food-cost base by themselves.
Specialty suppliers operate differently. Meat purveyors and produce houses quote weekly off market reports (the daily produce sheet, the weekly protein bulletin). Prices move with the market and contracts are usually informal. The discipline here is not negotiating the markup (which is small and stable) but specifying exactly what you want: breed, age, grade, cut, trim level, portion size, packaging. A poorly specified spec costs you on every order through quality drift and yield variance, both of which show up as food-cost creep without ever appearing on a price quote. The Tableview Inventory module captures the spec on every SKU and flags variance against it on receiving; in our customer data, operators who tighten specs see a 0.4-0.8 point food-cost improvement inside one quarter just from killing quality drift.
Sitting on top of both tiers is a fast-growing layer of procurement technology. Group purchasing organisations (GPOs) like Buyers Edge, Dining Alliance and Foodbuyer aggregate independent restaurants into a collective buy and pass back negotiated rebates - typically 1-4% of qualifying spend, paid quarterly. Order-management platforms (BlueCart, Notch, Cut+Dry, Choco, and increasingly POS-native modules) digitise the ordering process, capture every invoice digitally, and flag price variance automatically. The combination of a GPO membership and an order-management platform is now table-stakes for independents over $1.5M; the spend is small and the return is consistent.
The seven hidden cost drivers operators never benchmark
Most independent operators benchmark one thing about a supplier: the price per unit on the invoice. That is the wrong number, and benchmarking on it produces wrong decisions roughly half the time. The Vendor Cost Comparison calculator below folds in all seven drivers; the prose explains why each one matters and where the trap lives.
One: pack size. A vendor quoting $3.50/lb on a 40 lb case is selling the same product as a competitor quoting $140 per case of 40 lb. Same per-pound number, but the pack size of a competing supplier (60 lb cases at $3.20/lb) may force you to buy more than you can use in a delivery cycle, increasing waste and tying up walk-in space. Cost per usable unit, not cost per case, is the only honest comparison.
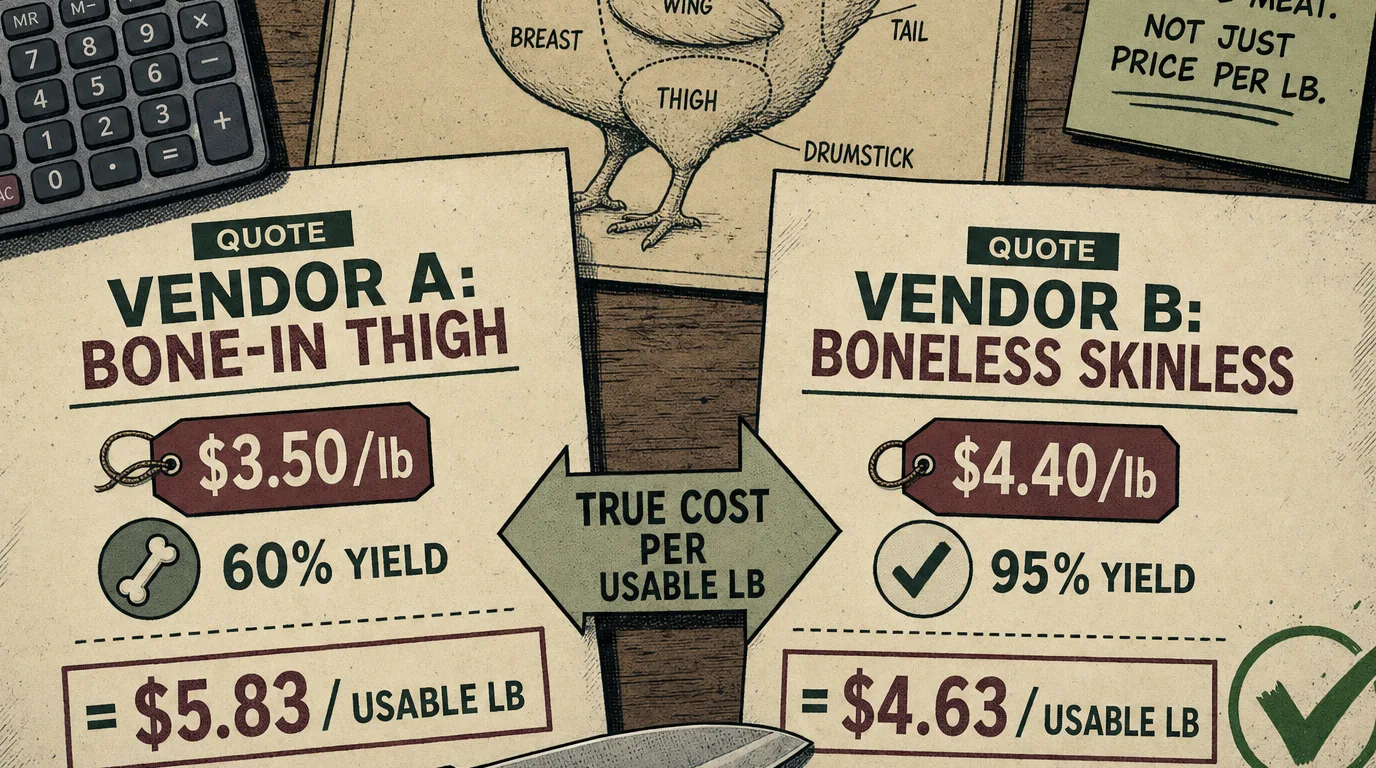
Two: yield. Two suppliers quoting bone-in chicken thighs at the same per-pound number deliver very different food costs once the bone yield, fat trim and pan loss work through. A 95% yield boneless skinless thigh at $4.40/lb lands cheaper on the plate than a 60% yield bone-in thigh at $3.50/lb. The food cost percentage guide walks through the yield-loss math; in procurement, the rule is to spec yield on every protein SKU and demand the supplier's tested yield figure on samples above $1,000/month spend.
Three: delivery cost and frequency. Most broad-liners have a minimum-order threshold ($350-$500 typical) below which a delivery surcharge applies, plus a fuel surcharge that is invisible until you look for it. A second supplier you only use for one or two SKUs almost always fails the minimum and triggers $25-$60/delivery fees. Either consolidate the order into the broad-liner, switch the specialty supplier to weekly drops, or factor the delivery fees into the landed cost. The calculator does this folding automatically.
Four: payment terms and cash discount. Standard broad-liner terms are Net 14 or Net 21. Specialty suppliers often offer 2/10 Net 30 (2% discount if paid within 10 days). A 2% discount on a $20,000/month spend is $4,800/year in pure margin if you pay early. Most operators leave the discount on the table because the cash-flow discipline of paying inside 10 days feels harder than the discount feels valuable. The right way to think about 2/10 Net 30 is that you are borrowing money at an effective annual interest rate of 36-37% by not taking it. No business loan costs that much. Take the discount, or renegotiate the terms.
Five: rebates and GPO membership. If you are buying $15,000+/month from a broad-liner without a GPO affiliation, you are leaving 1-4% of qualifying spend on the table in rebates. GPOs charge zero or near-zero membership fees and rebate quarterly. Buyers Edge, Dining Alliance and Consolidated Concepts are the three most common independent GPOs in North America; Booker, Beacon and Caterforce serve the UK independent market. A single afternoon of enrollment is worth $3,000-$9,000 a year on a typical independent's broad-line spend.
Six: contract pricing and price holds. The distributor will quote contract pricing (price locked for 60-90 days) on any SKU you commit to buy in volume, but the rep almost never offers it unsolicited because contract pricing reduces their flexibility to re-quote on the next visit. Volume items in any category - chicken thighs, mozzarella, romaine, white onions, frozen french fries - deserve contract pricing every quarter. Ask for it explicitly. Tableview Procurement lets you track which SKUs are under contract, when the contract expires, and the price gap against street, so the renegotiation conversation is data-driven instead of hopeful.
Seven: shrinkage at receiving. The least-managed cost driver in independent kitchens is what happens between the truck and the walk-in. Cases are short. Boxes contain the wrong cut. Produce arrives soft and is accepted because the next delivery is Friday and the menu needs the item Tuesday night. Every accepted-but-not-credited short-ship is pure food cost. The discipline is a receiving log (digital or paper), a habit of opening every box at the truck before signing, and a written credit policy with the supplier. Average recovery on a credit policy is 0.3-0.7 points of food cost - small per month, large per year.
The 90-day procurement RFP process that actually works
The biggest single act of value creation in an independent restaurant's first year of disciplined procurement is the comprehensive RFP - a structured request for proposal across the top 30-50 SKUs that make up 70-80% of food spend, run against three competing broad-liners plus the existing supplier. Done well, this exercise routinely delivers 4-7% on the food-cost base inside one quarter, without any quality concession.
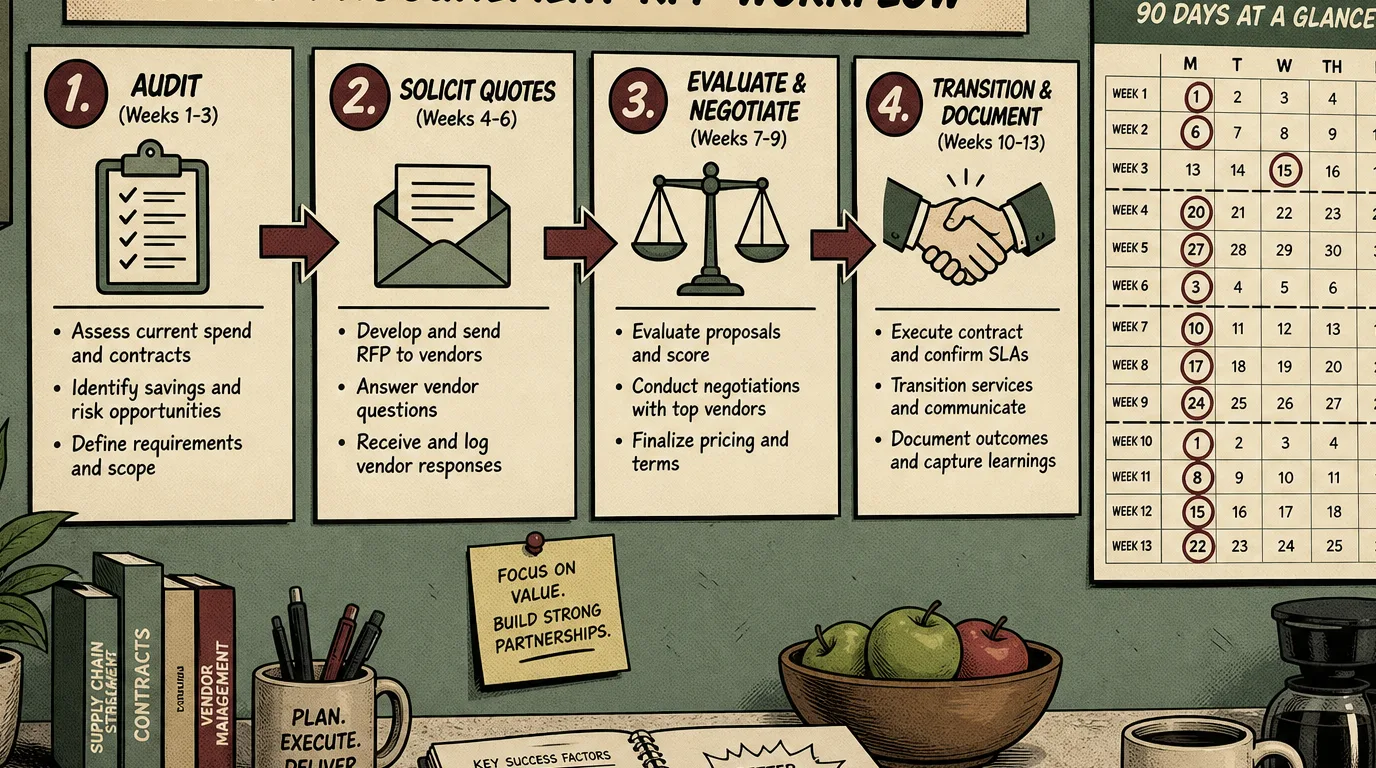
The 90-day timeline is deliberate. Procurement is a trust exercise with the kitchen, the supplier and the operator's own cash-flow expectations. Compressing it to 30 days produces a pricing win and a quality regression; stretching it to 180 days lets the moment slip and the existing supplier rebuild the inertia. Ninety days is the sweet spot, and it breaks into four clean phases:
Weeks 1-3: audit and specification. Pull the last 13 weeks of invoices into a spreadsheet (or, ideally, into Tableview Procurement which does this automatically). Identify the top 50 SKUs by spend. For each, document the current specification in the level of detail a competing supplier would need to quote against: brand, pack size, count, grade, origin, organic/conventional, cut, trim level, portion weight, packaging, frozen or fresh. The discipline here is brutal: an item that costs $4.40/lb under spec A and $3.95/lb under spec B is not the same item and the prices are not comparable. The audit phase often surfaces 5-10% of SKUs where the kitchen has been substituting silently for months because the original spec was unavailable; that finding alone is worth the exercise.
Weeks 4-6: solicit quotes. Send the spec list to three competing broad-liners (the incumbent plus two genuine challengers) plus the specialty suppliers in any category where a specialty would compete. Use a structured RFP template that requires each supplier to quote: unit price, pack size, contract availability, contract length, payment terms, delivery frequency, minimum order, GPO compatibility, and the named substitutions they would offer if the spec'd SKU went short. Reject any quote that does not match the spec exactly - the substitution conversation belongs at evaluation, not at quote.
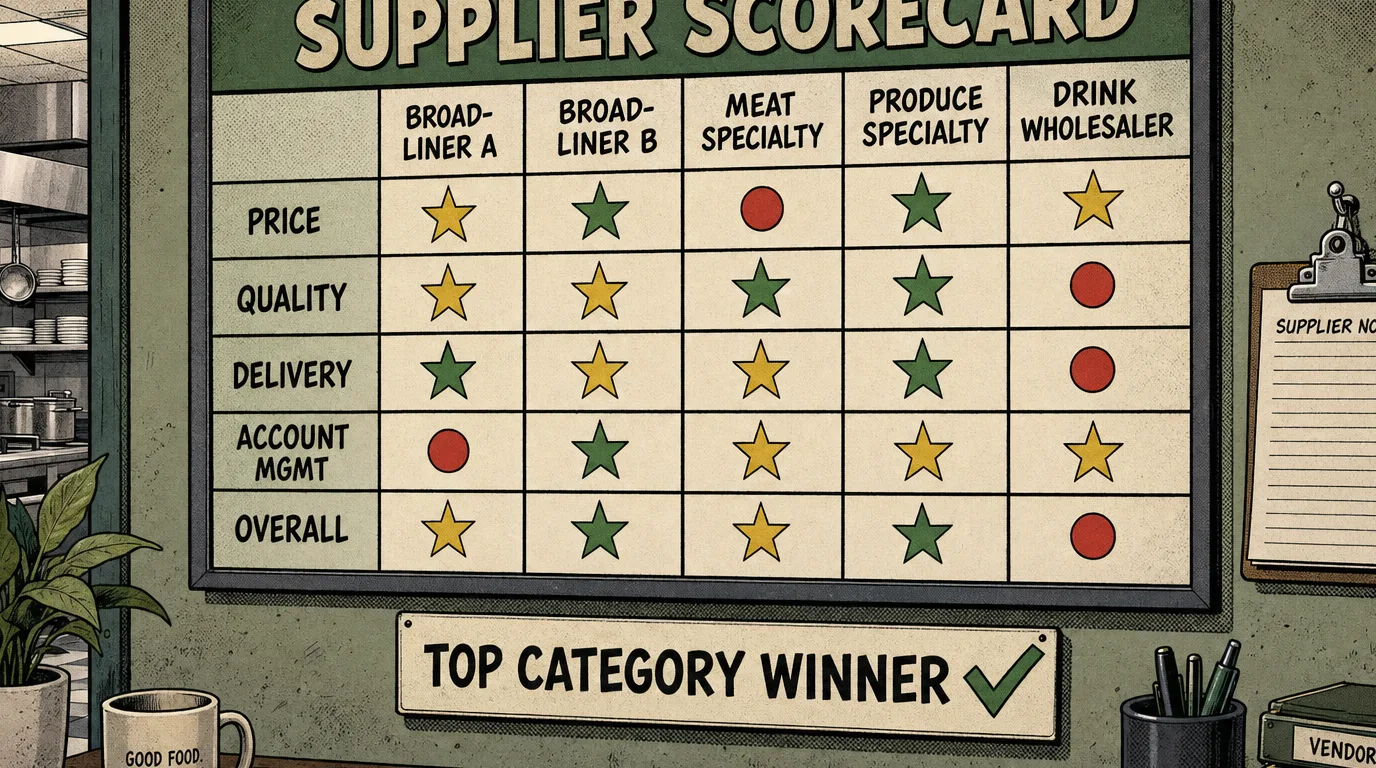
Weeks 7-9: evaluate and negotiate. Run every line through the Vendor Cost Comparison calculator to get true landed cost per usable unit including delivery, payment terms, yield and pack size. Score each supplier on landed cost (60% weight), quality of substitutions offered (20% weight), delivery flexibility (10% weight), and account-management strength (10% weight). The incumbent almost always wins on account-management strength because of the existing relationship; the challenger that wins on landed cost needs to be 5%+ ahead to overcome the relationship inertia. Take the analysis back to the incumbent and ask them to match. They will move on roughly 70% of SKUs without losing the business; on the 30% they cannot match, switch with documented data and a 30-day overlap.
Weeks 10-13: transition and document. Switch suppliers item-by-item with a 30-day quality overlap (you buy the switched SKU from the new supplier and keep a small safety stock from the incumbent in case quality is a regression). Tighten receiving discipline during the transition; new supplier first deliveries are when most quality drift gets through. Document the new pricing, contract dates, and substitution menu in your back-of-house system so the win persists when the chef or GM rotates. The first quarter after a clean RFP typically holds 80-90% of the modelled savings; the discipline of the documented transition is what keeps the other 10-20% from leaking back over the next two quarters.
The contract terms that protect you from market spikes
The pricing structures above are only half the protection an operator needs. The other half lives in the contract language itself, where five specific clauses determine whether a 12-month relationship saves the modelled $13,600-$20,400 or quietly gives it all back in mid-cycle price increases. Most independent operators sign whatever the supplier puts in front of them; the disciplined ones modify five specific clauses.
Price-change notice period. Default in most foodservice contracts is "prices subject to change without notice". Insist on 14- to 30-day written notice on any price increase greater than 3%, with the right to re-quote competing suppliers before accepting. This single clause prevents the most common post-honeymoon move: gentle quarterly price drift that totals 4-6% over the year without ever triggering a renegotiation conversation.
Index-linked exception for commodities. For genuinely commodity items (chicken, beef, dairy, produce in season), index pricing to a published market reference (the USDA daily report, the CME futures close, the local produce auction price) plus a fixed markup. This protects both sides: the supplier is not eating margin when commodities spike, the operator is not paying inflated pricing when commodities crash. Six months into the contract, the index language is worth 1-2% on commodity spend.
Substitution policy. Specify in writing what substitutions the supplier may make when the contracted SKU is short, and what notice is required. The default is "supplier may substitute comparable product at supplier's discretion", which produces 6 oz ribeyes substituted with 8 oz New York strips at the same price (good for you) and equally often a $4.40/lb spec'd item substituted with a $5.20/lb non-spec item with no price adjustment (bad for you). Require written notice with price-adjustment language for any non-spec substitution.
Receiving and credit window. The contractual window for short-ship credit is typically 48 hours, but the operational reality of independent kitchens is that a short-ship discovered Friday morning rarely gets reported before Monday. Negotiate a 5- or 7-day credit window in writing, and tighten the receiving discipline against it. Tableview Procurement captures every receiving event digitally and produces the credit request automatically when a short-ship is logged.
Volume commitment and exit terms. Broad-liners will offer better pricing in exchange for a minimum monthly volume commitment ($20,000/month, $40,000/month). The lower pricing is real and significant (typically 2-4% on the committed volume), but the exit terms matter more than most operators read. A 12-month commitment with a 90-day exit clause is usable; a 24-month commitment with liquidated-damages language is a trap. The right principle: never commit to a longer term than you would accept being locked into if the supplier's service quality degraded.
Building the vendor portfolio: how many suppliers, where the lines should fall
The most common procurement mistake in independent restaurants is running too few suppliers (one broad-liner, no genuine competition, no specialty depth) or too many (eight different small specialties that each fail the delivery-minimum threshold). The portfolio question is one of the most useful disciplines for an owner-operator to think through once a year.
A well-constructed independent procurement portfolio at $1-3M revenue typically looks like this. One primary broad-liner holding 50-60% of food spend across the high-volume centre of the catalogue (frozen, dairy staples, dry goods, bulk produce, non-premium proteins). One challenger broad-liner holding 10-15% of food spend on items where they consistently beat the primary, kept active in the relationship so the competitive tension stays real. One protein specialty (whole-animal butcher, regional packer, named-source supplier) for the differentiated proteins that signal the menu's quality and where the broad-liner pack-and-grade does not meet the spec. One produce specialty (regional produce house, farm cooperative, weekly market drop) for seasonal and premium produce where the freshness premium pays back through the value-tier multiplier on menu pricing. One drink wholesaler per category (beer, wine, spirits) with the pour cost discipline that the bar program requires. That comes to 5-7 suppliers total, manageable for a single owner or GM, producing genuine competitive tension without the operational fragmentation of running 12 small accounts.
The reason this structure works is that it preserves real competitive tension at the broad-liner level (the single biggest spend category) while concentrating specialty relationships where specialty is genuinely worth the premium. The common failure modes are running 100% with one broad-liner (no leverage at contract renewal, no benchmark for price moves) or running 100% on specialty relationships (no scale discount, fragmented receiving, fragmented account management, fragmented payment terms). A well-portfolioed independent ends up paying 3-6% less on food cost than either failure mode.
The quarterly review rhythm that keeps the savings stuck
Procurement wins are easy to capture and hard to keep. The 90-day RFP delivers 4-7% on day one; without a sustained review rhythm, half of that leaks back inside 12 months through quiet price drift, spec creep, substitution tolerance, and the relationship inertia that lets the incumbent walk pricing back toward street levels. The discipline that locks the wins in is a quarterly procurement review, which takes a single Tuesday morning and pays back 4-8x its time investment over the year.
The agenda is short. Item one: pull the price-variance report for the top 30 SKUs since the last review. Flag every SKU that moved more than 3% in either direction. For increases, request the supplier's market data and either accept the change in writing or re-quote. For decreases, confirm the new price has stuck. Item two: re-rank the supplier scorecard on landed cost, quality, delivery, account management. Any supplier whose score dropped more than 10% triggers a written feedback conversation; any whose score dropped more than 25% triggers re-quoting the affected categories. Item three: review the contract calendar. Any contract expiring inside 60 days gets put out to re-quote. Any contract whose price holds are about to lapse gets a renewal-pricing conversation. Item four: the kitchen feedback round. Sous chefs and line cooks see quality drift in real time; the GM sees price drift on the invoice. The quarterly review is the forum where the two views meet and become a decision.
The operators who run this rhythm religiously land in the top quartile of independents on food-cost stability. The ones who run the RFP once and never run the quarterly review give back most of the savings by month 12 and run the RFP again two years later having achieved nothing structural. The first kind of operator can focus on menu and service knowing the buy is disciplined; the second kind is perpetually fighting the food-cost line. The right back-of-house software makes this review a 90-minute exercise instead of a half-day spreadsheet expedition, which is the difference between a discipline that happens every quarter and one that gets skipped because the operator is busy.
Format-specific procurement playbooks
The general principles above apply to any format, but the emphasis shifts meaningfully by venue type. The compressed playbook for each of the major formats:
Quick-service / fast-casual. 70-80% of food spend lives in 20-30 SKUs. Contract pricing is the highest-leverage tool because the volume per SKU is high and stable. GPO membership is essentially mandatory; the rebate alone funds the procurement discipline. Specialty suppliers play almost no role. Focus the quarterly review on the top 20 SKUs and on packaging (which often becomes the second-largest line after protein).
Casual full-service (independent). The modal pattern this guide is built around. 5-7 supplier portfolio, quarterly review, RFP every 18-24 months. The menu engineering matrix points to which items deserve the specialty premium and which should stay in the broad-line catalogue. Procurement wins on a casual full-service P&L typically run 2-4% of revenue.
Polished casual / upscale casual. Specialty relationships dominate the spend mix (35-50% of food cost). The named-source story on the menu (the farm, the breed, the named producer) supports the premium pricing and amortises the specialty's per-pound cost. Quarterly review focuses less on re-quoting (specialty pricing is closer to market-take) and more on portion discipline and yield. Contract language matters more than headline pricing because supply continuity is a brand risk.
Fine dining / steakhouse. The procurement function is essentially a sourcing function. The chef-owner spends disproportionate time on supplier relationships, often visiting the farm or the boat. Price elasticity at this format is high (a $48 entrée carries a $14 plate cost comfortably), so the operating discipline is yield management and quality consistency rather than price negotiation. The value-tier multiplier on a fine-dining signature item is what makes the specialty premium economically defensible.
Bar and beverage-led venues. The drink distribution model is different enough that it deserves its own playbook (see the bar pour-cost guide), but the principle is the same: portfolio of suppliers, contract pricing on volume SKUs, quarterly review of price variance. Beer distribution is essentially three-tier-regulated in the US so pricing leverage is limited; wine and spirits offer meaningful negotiating room on volume accounts.
Hotel and resort F&B. Procurement is usually centrally managed at the property or chain level; the F&B operator's discipline is to push back on the corporate contracts where they fail the on-property spec, and to negotiate the local specialty exceptions that the chain contract does not cover. The chain rebate share is a meaningful slice of property P&L when the volume is large.
Where procurement software fits in the modern restaurant tech stack
The 2010s version of restaurant procurement was a spreadsheet, a filing cabinet of invoices, and a weekly call with the sales rep. The 2026 version sits in the restaurant tech stack as a connected layer between the POS (which knows what you sold), the kitchen and recipe system (which knows what each dish should cost), the inventory module (which knows what is on the shelf), and the accounting system (which pays the bills and reports the P&L). The right software changes procurement from a discrete weekly task into a continuous control loop.
The minimum viable procurement stack for an independent in 2026 has four capabilities. One: digital invoice capture (scan or email-in PDF, OCR'd to line items, attached to each delivery). Two: SKU-level price-variance tracking against contract or rolling 90-day average, with alerts on any move greater than 3%. Three: integrated ordering (place the order from the same system that holds the spec and the pricing history, so the order itself becomes data). Four: a connection to the inventory and POS layer so theoretical food cost (recipes × sales) can be compared to actual food cost (invoices × on-hand variance) and the gap attributed to either purchasing, portioning, waste or theft.
Tableview Procurement ships with these four capabilities native and connects directly to the Tableview POS, Tableview Inventory and Tableview Accounting modules, so the loop is closed without a third-party integration layer. The operators in our customer base who use the connected stack typically run 1.2-1.8 points lower on food cost than equivalent operators running disconnected tools. The connectivity matters because food cost is structurally a multi-system problem - purchasing, inventory, portioning, sales mix - and any one of those systems in isolation produces an incomplete picture.
The supplier negotiation script that works
Most independent operators avoid the negotiation conversation because it feels confrontational and the existing relationship is the path of least resistance. The negotiation conversation does not have to be confrontational; it just has to be data-driven and consistent. The script below is the one Tableview customers use most often when re-quoting the incumbent broad-liner after the 90-day RFP.
"Hi [rep name], I appreciate the partnership we have had over the last [X] years. I have just completed a competitive review on our top 50 SKUs as part of an annual procurement discipline I am running. The headline finding is that on landed-cost-per-usable-unit basis - factoring pack size, delivery and yield - we are paying roughly [X]% more with you than the average of the two competing quotes I have in hand. I would much rather keep our relationship than switch, so I am bringing this to you first. Specifically, on these [N] SKUs [emailed attachment], the competing quotes are an average of [X]% better. Can you walk through those with me line by line and tell me where you can match, where you can come close, and where you cannot move? My intention is to keep the SKUs where you can match or get within 2-3%, and to switch the ones where the gap is genuinely structural. I will give you the data, including the calculator I am using, so you can see exactly how I am arriving at the comparison. When can we schedule that walkthrough?"
Three things make this script work. One: the conversation opens with acknowledgement of the relationship, which lowers the defensiveness. Two: the data is shared in full, which both respects the rep's intelligence and prevents the "your numbers are wrong" defence. Three: the framing is "I want to keep you", which gives the rep the political room internally to ask for a discretionary discount they would never grant under a "we are switching" framing. The typical outcome is 60-75% of the SKUs moved by the incumbent to match or close, 20-30% switched cleanly, and 5-10% kept at original pricing because the spec or service genuinely justifies the gap. Margin captured: 3-6% on the food-cost base.
The four KPIs that prove procurement is working
Procurement is a discipline, and like every discipline it needs a small set of measurable signals to confirm that the discipline is actually delivering. The four numbers worth tracking monthly:
Food cost percentage: total food cost divided by total food revenue, calculated from the P&L. The headline number that everything else explains. A procurement win shows up in this number first.
Theoretical-to-actual food cost variance: recipe-cost-times-sales (theoretical) minus actual cost-of-goods (invoices net of inventory change). The gap is the sum of shrinkage, waste, portioning error, and procurement variance. A 2-3% gap is healthy; a 5%+ gap is a structural problem worth running the food cost calculator on every shift to find.
Price-variance index: percentage of top-30 SKUs whose price moved more than 3% since the last quarterly review. A healthy procurement program holds this number under 15%; an undisciplined one runs it at 35-45% and the rolling-90-day trend tells the operator everything they need to know about supplier discipline.
Substitution rate: percentage of orders where the supplier substituted a non-spec SKU. A healthy program runs under 5%; substitutions over 8% indicate either weak supplier inventory discipline or a spec set the supplier cannot reliably serve, both of which are negotiation triggers.
These four numbers, tracked monthly with a quarterly deep-dive, are the operator's procurement dashboard. They turn what would otherwise be an annual fire-drill into a managed control loop. The Tableview calculators hub ships free calculators that produce three of the four numbers from the operator's existing P&L and recipe data.
Two operator stories: what disciplined procurement looks like in practice
Case one: a 90-seat casual full-service bistro in Portland. Annual revenue $1.4M, food cost running at 33% on a 28% target. Owner-operator inherited the supplier relationships from the previous owner three years prior and had never run a competitive review. Q4 2025, walked through the 90-day RFP process described above. Top 38 SKUs went out to the incumbent (US Foods) plus two challengers (Sysco and a regional specialty meat house). Landed-cost analysis (via the Vendor Cost Comparison) showed a 4.8% average gap against the better of the two challengers, weighted by spend. Incumbent matched on 22 SKUs after the negotiation conversation, came close (within 2%) on 9, lost cleanly on 7 (switched to challenger). Net annual saving: $23,400, or 4.9% of food spend. Food cost moved from 33% to 30.2% over the next two quarters. Owner described the time investment as roughly 40 hours of focused work plus a quarterly half-day for the review rhythm.
Case two: a 35-seat polished-casual restaurant in Lisbon. Annual revenue €620K, food cost running at 36% on a 32% target (the higher band that polished-casual carries). Chef-owner had built the supplier portfolio on relationships and named-source storytelling, with seven specialty suppliers and no broad-liner anchor. The RFP exercise here was different: introducing a broad-liner as anchor for the centre of the catalogue (dry goods, dairy staples, frozen produce) while preserving the specialty relationships for the menu's differentiated proteins and produce. Brought in Recheio (broad-line distributor) for the centre 25 SKUs at a 6.2% landed-cost improvement, while leaving the protein and produce specialties intact. Negotiated 2/10 Net 30 terms with three of the specialties (worth €4,800/year alone). Net annual saving: €18,200, or 4.7% of food spend. Food cost moved from 36% to 33.4% over four months. The key insight for the chef-owner was that the specialty relationships did not need to defend every SKU; they needed to defend the dishes that drove the menu's value tier and let the unsung centre of the catalogue go to the broad-liner.
Both stories illustrate the same pattern. Disciplined procurement is not a cost-cutting exercise that compromises the menu. It is a portfolio-management exercise that puts the right spend in the right channel. Done well, it preserves or improves quality while moving 3-5 points of margin from supplier surplus to operator surplus, which is the single largest reliable margin lever available to an independent restaurant in 2026.
What to do Monday morning
This guide is long because procurement is layered. The Monday morning version is short. One: pull last quarter's invoices and identify the top 20 SKUs by spend. Spend an hour running them through the Vendor Cost Comparison against one alternative quote from a competing broad-liner; you will find one or two SKUs where the gap is large enough to act on immediately. Two: review your current contract for the five clauses listed in the contracts section; flag the ones that are missing or one-sided and renegotiate at next renewal. Three: enrol in a GPO if you have not already; the membership is free or near-free and funds itself in the first quarter. Four: book the first quarterly review on the calendar. The rhythm only sticks if it is in the diary.
The structural shift that turns procurement from a back-office chore into a margin engine is the same shift that the best restaurant operators have always made: treating the buy as a strategic discipline with measurable inputs, written contracts and a quarterly review cadence. The Tableview Procurement module exists to make the discipline easy: digital invoice capture, SKU-level price-variance alerts, integrated ordering, and the single connected loop with POS, inventory and accounting that turns disconnected weekly tasks into a continuous control system. The savings show up first in food-cost percentage, then in prime cost, then in the EBITDA line that ultimately determines what your restaurant is worth. None of that requires a different recipe, a different chef, a different menu price or a different concept. It just requires reading the invoice.
Related reading
For the cost-and-margin context that procurement sits inside: the food cost percentage guide, prime cost guide and P&L statement guide. For the menu side of the same equation: menu pricing strategy and menu engineering. For the operational neighbours: restaurant inventory system, reducing restaurant food waste, FIFO methodology and the SKU naming conventions that make procurement data tractable. For the wider business context: break-even analysis, payment processing fees, industry trends 2026, and the business plan template for operators opening their next venue.