
Your dining room is full, your Instagram looks great, and your bank account is flat. That contradiction is the restaurant business in one sentence. The average restaurant keeps three to five cents of every dollar it brings in, and plenty of busy, beloved places keep less. The difference between the operators who build wealth and the ones who quietly subsidize their guests' dinners is rarely the concept or the chef; it is whether the owner can see the margin forming, week by week, while there is still time to act. That visibility starts with clean books connected to daily sales, which is exactly the job of restaurant accounting that talks to the till instead of living in a shoebox of receipts.
This guide gives you the honest numbers: average margins by concept type, the difference between the gross margin people brag about and the net margin that pays your mortgage, the four cost blocks that consume the other 95 cents, and the levers that actually move the number. Everything here assumes your sales data is trustworthy, because you cannot manage a margin you cannot measure; if items, comps, and voids are not flowing cleanly out of your restaurant POS, fix that first and the rest of this article gets ten times easier.
Gross versus net: the two margins people confuse
When a bar owner says they make 80 percent on a gin and tonic, they are talking about gross margin: the selling price minus the cost of the liquid in the glass. Gross margin in a healthy restaurant runs 65 to 70 percent across the menu. It has to, because every other expense in the building comes out of it.
Net margin is what survives after everything: cost of goods, labor with taxes and benefits, rent, utilities, insurance, card processing, marketing, repairs, subscriptions, linen, pest control, the credit card fee on the gift card someone bought with another credit card. That is the famous 3 to 5 percent.
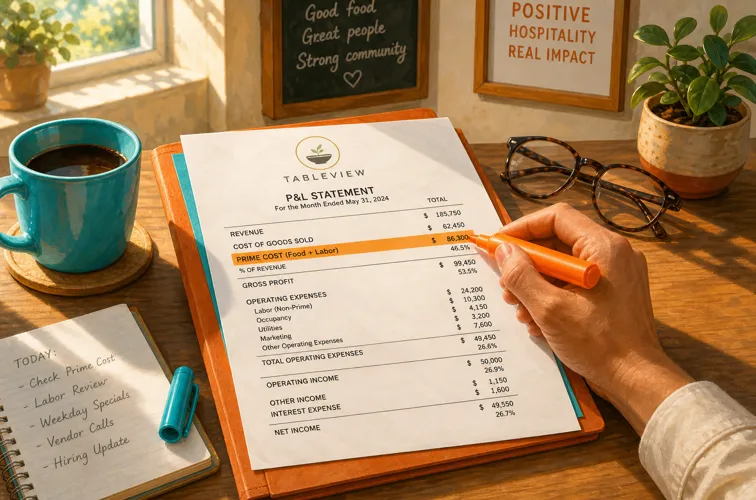
The gap between the two is where restaurants live and die. A 70 percent gross margin with sloppy labor scheduling and a heavy lease nets zero. A 62 percent gross margin with tight prime cost discipline can net eight. Neither number means anything alone, which is why your P&L statement matters more than any single percentage.
Average margins by restaurant type in 2026
Industry averages spanning everything from a taco truck to a tasting menu are nearly useless, so here is the honest breakdown by concept. Ranges reflect current industry benchmarks; your market and lease can push you outside them in either direction.
Full-service casual dining: 3 to 6 percent net. The heaviest labor load per sales dollar (often 33 to 38 percent) keeps this segment at the bottom of the table. Anything above 5 is outperforming.
Fine dining: 4 to 8 percent net. Higher checks help, but food cost runs 30 to 35 percent and the service standard demands deep staffing. Volume is the constraint: fewer seats, fewer turns.
Quick service: 6 to 9 percent net. Lower food cost (20 to 25 percent), counter service labor, and speed. The model is built for margin; the risk is volume dependence.
Fast casual: 4 to 10 percent net. The wide range reflects how differently these operate: some run QSR-tight, some carry FSR-level labor with counter-service prices.
Bars and pubs: 10 to 15 percent net. Alcohol gross margins of 70 to 80 percent carry the model. The trap is treating beverage margin as automatic; without pour control it evaporates one heavy pour at a time.
Coffee shops: 6 to 18 percent net. Beverage margins rival bars, but rent per square foot in the locations that drive volume can consume the advantage.
Pizza, delivery-heavy: 7 to 12 percent net. Cheap ingredients, high perceived value. Third-party commissions are the margin killer to watch.
Food trucks: 3 to 8 percent net. Low overhead but low ceiling; weather and location churn make consistency the challenge.
Ghost kitchens: 15 to 20 percent net at the top end. No dining room, no front-of-house labor, industrial rent. The margin lives or dies on delivery platform fees and marketing costs, which replace the rent you are not paying. Without a storefront doing free advertising, every order has an acquisition cost, and the operators who forget that discover their theoretical margin was funding the platforms' growth instead of their own.
Catering: 7 to 12 percent net. Known headcounts and prep windows reduce waste, and labor is scheduled to the event instead of to hope.
Where the money actually goes
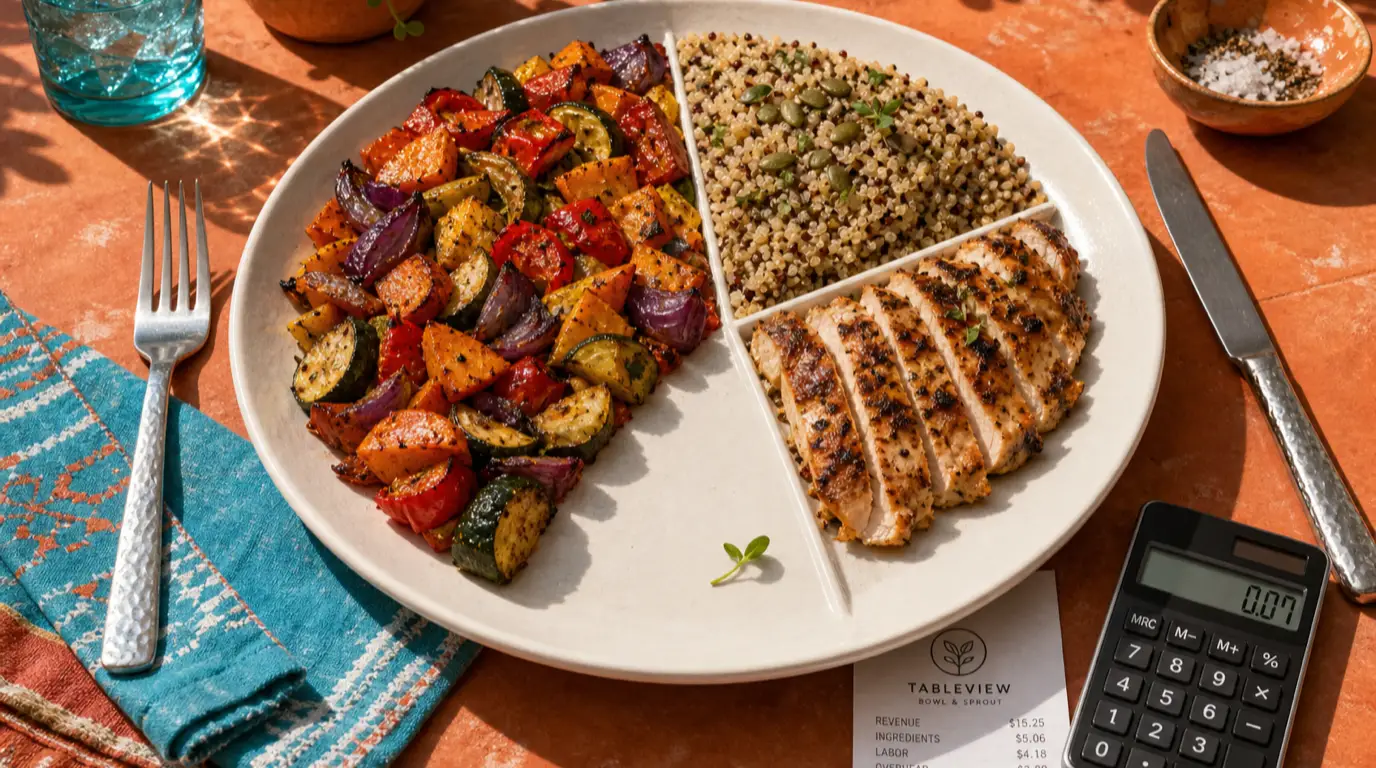
Take a full-service restaurant doing $80,000 a month. A typical dollar breaks down like this:
Food and beverage cost: 28 to 32 cents. Everything you plate and pour, including the waste, the over-portioning, and the comps nobody logged. Our food cost percentage guide covers the calculation and the leaks.
Labor: 30 to 35 cents. Wages plus the parts people forget: payroll taxes, benefits, training hours, overtime creep. This is usually the largest single block in full service.
Occupancy: 6 to 10 cents. Rent, property taxes, insurance. The only block you cannot manage weekly, which is why the lease you sign determines years of margin before you serve a single plate.
Operating everything-else: 18 to 25 cents. Utilities, card processing, marketing, repairs, software, smallwares, linen, trash, accounting. Individually small, collectively the third-largest block and the least watched.
What remains: 3 to 6 cents. That is the business.
Food plus labor is your prime cost, and it deserves its own weekly ritual. Full-service operators should hold it at or under 60 percent of sales; quick service under 55. Above 65, no amount of revenue growth saves the model, because every incremental dollar arrives carrying the same bloated costs. The deep dive lives in our prime cost guide.
A worked example: the $80,000 month
Abstract percentages hide the drama, so here is a plausible month for a 70-seat full-service restaurant, in dollars.
Sales: $80,000. Food $62,000, beverage $18,000.
Cost of goods: $24,400 (30.5 percent). Food cost ran 32 percent this month because two salmon deliveries got binned and the new grill cook plates heavy; beverage held at 24.
Labor: $26,000 (32.5 percent). Wages $21,800, payroll taxes and benefits $3,400, plus $800 of overtime from that week the dishwasher quit.
Prime cost: $50,400, or 63 percent. Three points above target, which at this volume is $2,400 that left the building without a receipt.
Occupancy: $6,800 (8.5 percent). Rent, property insurance, taxes. Fixed, signed, unmovable until the lease renews.
Everything else: $19,300 (24 percent). Utilities $2,600, card processing $2,240 (2.8 percent effective, worth auditing), marketing $1,500, repairs $1,800 (the walk-in compressor), software and subscriptions $900, supplies, linen, trash, accounting, insurance, and the pile of small recurring charges nobody has reviewed since opening.
Net: $3,500. A 4.4 percent margin.
Now replay the month with the boring disciplines in place: food cost at 29.5 (portioning plus a weekly count catches the heavy plating in week one), labor at 31 (the overtime gets flagged the day it starts, and Tuesday's habitual overstaffing gets cut), processing renegotiated to 2.45 percent. Same sales, same rent, same menu: net becomes roughly $6,700, an 8.4 percent margin. Nearly double, and no guest noticed a thing. That invisible gap is the entire argument for weekly numbers.
Margin is not cash: the trap that closes profitable restaurants
A P&L can show profit while the bank account starves. Margin is an accounting concept; cash is timing. The three places they diverge:
Inventory eats cash before it earns. The $8,000 of product in your walk-in was paid for (or is owed) before a single plate sold. Growing sales means growing inventory, which consumes cash exactly when you feel most successful.
Bills and revenue run on different calendars. Rent is due on the first, payroll every two weeks, your produce supplier on seven-day terms, while your busiest revenue lands unevenly across the month. A profitable month can still contain a week where payroll bounces.
CapEx never appears on the P&L all at once. The $14,000 walk-in replacement hits cash today and the P&L over years of depreciation. Restaurants that keep no equipment reserve discover their margin was an illusion the day the hood system fails inspection.
The fix is a simple 13-week cash forecast beside the P&L: expected inflows and committed outflows, week by week. Ten minutes to update, and it converts nasty surprises into scheduled events. If your margin is real but cash is chronically tight, the problem is timing and reserves, not profitability, and the responses (terms negotiation, deposit policies, a reserve account) are different from cost-cutting.
The margin killers nobody budgets for
Most operators can recite their food cost target. Fewer can say what these are costing them:
Third-party delivery commissions. A 25 to 30 percent commission on a menu priced for dine-in margins produces orders that lose money with extra steps. Price delivery menus separately or steer volume to direct channels. Our guide to third-party delivery covers the math.
Card processing fees. At 2 to 3 percent of nearly every sale, processing quietly outspends your marketing budget in many operations. Audit the effective rate annually; the difference between 2.4 and 3.1 percent is real money at volume.
Comps and voids without reasons. One or two percent of sales disappearing as untracked goodwill is a full margin point. Require reason codes and review them weekly.
Overtime creep. Ten hours of unplanned overtime a week at time-and-a-half is a silent four-figure monthly leak.
Shrinkage and waste. The industry wastes a meaningful share of food purchased. Between over-prep, spoilage, and the walk-in mystery, an unmeasured kitchen typically runs 2 to 4 points of food cost higher than a measured one.
Subscription sprawl. The reservation tool you replaced but never cancelled, the marketing platform from the agency you fired, three overlapping analytics dashboards. Audit the card statement twice a year; most operators find several hundred dollars a month of software paying for nothing.
Seasonality treated as surprise. January is slow every single year, yet many operators staff and buy for it like October, then torch a quarter's margin in six weeks. Budget the slow months as slow, bank the strong ones, and let the schedule breathe with the calendar instead of fighting it.
Reading your margin monthly: the rhythm
Margins are not discovered; they are monitored. The operators who beat their segment share a boring habit: a weekly prime cost number and a monthly P&L review, on a fixed calendar, with last month and last year beside it.
Weekly: sales, food cost from purchases and inventory movement, labor from the schedule and actual hours, prime cost as a percentage. Twenty minutes with clean data.
Monthly: the full P&L, comps and voids by reason, processing fees as an effective rate, and the everything-else block line by line. Question anything that grew faster than sales.
Quarterly: supplier pricing review, menu engineering pass, lease and insurance check, subscription audit. The KPI guide covers the full dashboard if you want to go deeper than margin alone.
Raising the number: cost-side levers
Engineer the menu. Every menu has stars (popular, high margin) and dogs (unpopular, low margin). Reposition, reprice, or remove the dogs; give the stars prime menu real estate. A serious menu engineering pass is often worth two to three points of food cost without changing a single recipe.
Portion with tools, not feel. Scales, scoops, and specced recipes. A kitchen that eyeballs protein portions gives away margin one ounce at a time, and an ounce on a $12 protein across two hundred covers a night is real money.
Count inventory weekly. Shrinkage hides in unmeasured kitchens. A weekly count converts food cost from an opinion to a number and surfaces theft, waste, and vendor shorting within days instead of quarters.
Schedule to the forecast. Labor should follow projected covers, not the habit of who always works Tuesdays. Cutting one over-scheduled shift per day saves more than most marketing campaigns earn. Pair scheduling with sales data as covered in our staff scheduling guide.
Renegotiate annually. Suppliers, processing, insurance, linen, trash. Vendors reprice loyal, silent customers upward every year. A polite annual bid process claws back one to two points of the everything-else block.
Raising the number: revenue-side levers
Cost control has a floor; below a certain point you are cutting quality. Revenue levers compound without that ceiling.
Average check, gently. Server training on confident recommendations, dessert and beverage attach rates, and menu design that guides eyes toward stars raise checks without a price increase anyone notices. A dollar of check growth at a stable cost base flows almost entirely to margin.
Turnover at peak. If Friday night has a waitlist, every minute of dead table time is inventory expiring. Pay-at-table alone often saves several minutes per party; the full playbook is in our table turnover guide.
Fill the dead dayparts. The rent is paid for 24 hours a day. Weekday lunch offers, happy hour that actually converts, and catering that uses the kitchen between services all produce revenue against fixed costs you already carry.
Sell what you already own. Private events, off-premise catering, retail items, gift cards. Gift cards in particular are float plus breakage plus a guaranteed future visit.
Price with courage, informed by data. Most operators underprice out of fear and then compensate with silent portion cuts, which guests notice more than a fifty-cent increase. Reprice the items with inelastic demand (signatures, beverages) and leave the traffic drivers alone.
Benchmarking yourself honestly
Compare against your own concept type, not the industry average, and track direction before absolute position. A full-service room moving from 3 to 5 percent is winning; a bar coasting at 9 when the segment does 12 is leaving money on the table even though 9 beats the all-industry average.
Watch trailing twelve months, not single months. Restaurants breathe with the calendar: patio season, holidays, the January trough. A twelve-month rolling margin smooths the noise and shows the real trajectory, while a single hot December has fooled many operators into raises and renovations that the spring could not support.
Three numbers tell most of the story: prime cost percentage (weekly), net margin (monthly), and the everything-else block as a share of sales (monthly). If prime cost is at target and net margin still disappoints, the leak is in occupancy or operating costs, which points at the lease, the fees, or the subscription pile rather than the kitchen.
And benchmark your data quality itself: if your last physical inventory was a quarter ago, your food cost number is fiction, and every decision downstream of it inherits the error.
Same street, three businesses: why concept economics differ
Picture one block with a cocktail bar, a fast-casual bowl shop, and a 70-seat bistro. Same rent per square foot, same customer pool, wildly different margin machines.
The cocktail bar buys a bottle of gin for $18 and sells it as sixteen $14 drinks. Gross margin on beverage runs close to 80 percent, and the kitchen is a fryer and a cutting board. Its threats are shrinkage (every over-pour is pure margin loss), slow weeknights against fixed rent, and licensing costs. Net lands at 10 to 15 if the pours are honest and the room fills four nights a week; the deep dive is in our bar pour cost guide.
The bowl shop runs food cost near 30 but labor near 26, because guests order at the counter and bus their own trays. Its margin engine is throughput: a three-minute line at lunch is the whole business. Net of 6 to 10 when volume holds; a slow month hurts twice because the model has no high-margin beverage program to cushion it.
The bistro carries the full stack: servers, bussers, a real kitchen brigade, linen, breakage, and a wine list that ties up cash. Prime cost fights to stay under 62. Net of 3 to 6 in a good year, and yet it may build the most durable asset of the three, because regulars, private dining, and a reputation compound in ways a lunch line does not.
The lesson is not that one model is better. It is that copying tactics across models fails: the bar should obsess over pour control and dead-night programming, the bowl shop over line speed and throughput, the bistro over labor scheduling and check average. Diagnose your own margin using your own concept's physics.

A 90-day margin improvement plan
Days 1 to 15: see clearly. Get the P&L current. Set up weekly prime cost reporting. Start logging comps and voids with reasons. Run a full physical inventory to establish a real food cost baseline.
Days 16 to 45: stop the leaks. Portioning tools on the line, weekly inventory counts, overtime approval rule, delivery menu repriced for commissions, reason-code review in the weekly manager meeting.
Days 46 to 75: engineer. Menu engineering pass with item-level margin data. Reprice two or three inelastic items. Retire or rework the worst dogs. Rebuild schedules from cover forecasts.
Days 76 to 90: negotiate and lock in. Bid the top five suppliers, audit the processing statement, cancel dead subscriptions, and set the recurring calendar: prime cost weekly, P&L monthly, vendor review quarterly.
Operators who run this cycle typically find two to four points of margin in the first pass, which, in a business that nets three to five, is not an improvement. It is a transformation.
The uncomfortable truth about margins
A restaurant with great food and no financial rhythm is a hobby with payroll. The margin does not care how good the tasting menu is; it responds to weekly counts, honest scheduling, engineered menus, and fees that get audited instead of auto-paid. None of that requires an MBA. It requires a calendar, clean numbers flowing from the till to the books, and the willingness to look at them before the month is over.
Start this week: pull your last P&L, calculate your prime cost, and put a thirty-minute margin review on the calendar for every Monday. The number you keep is decided in those thirty minutes, not in the dining room.
Read next: Restaurant prime cost, The restaurant P&L statement, and Restaurant break-even analysis.