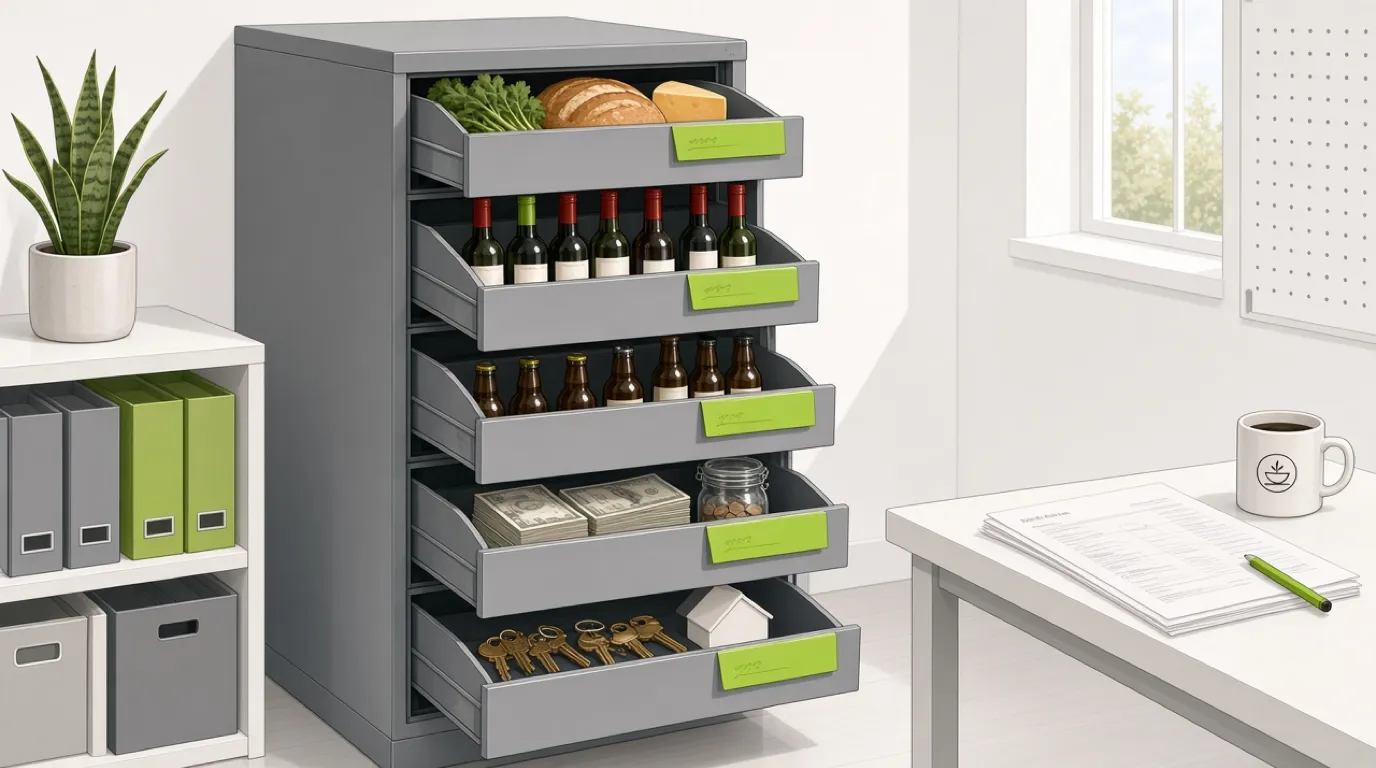
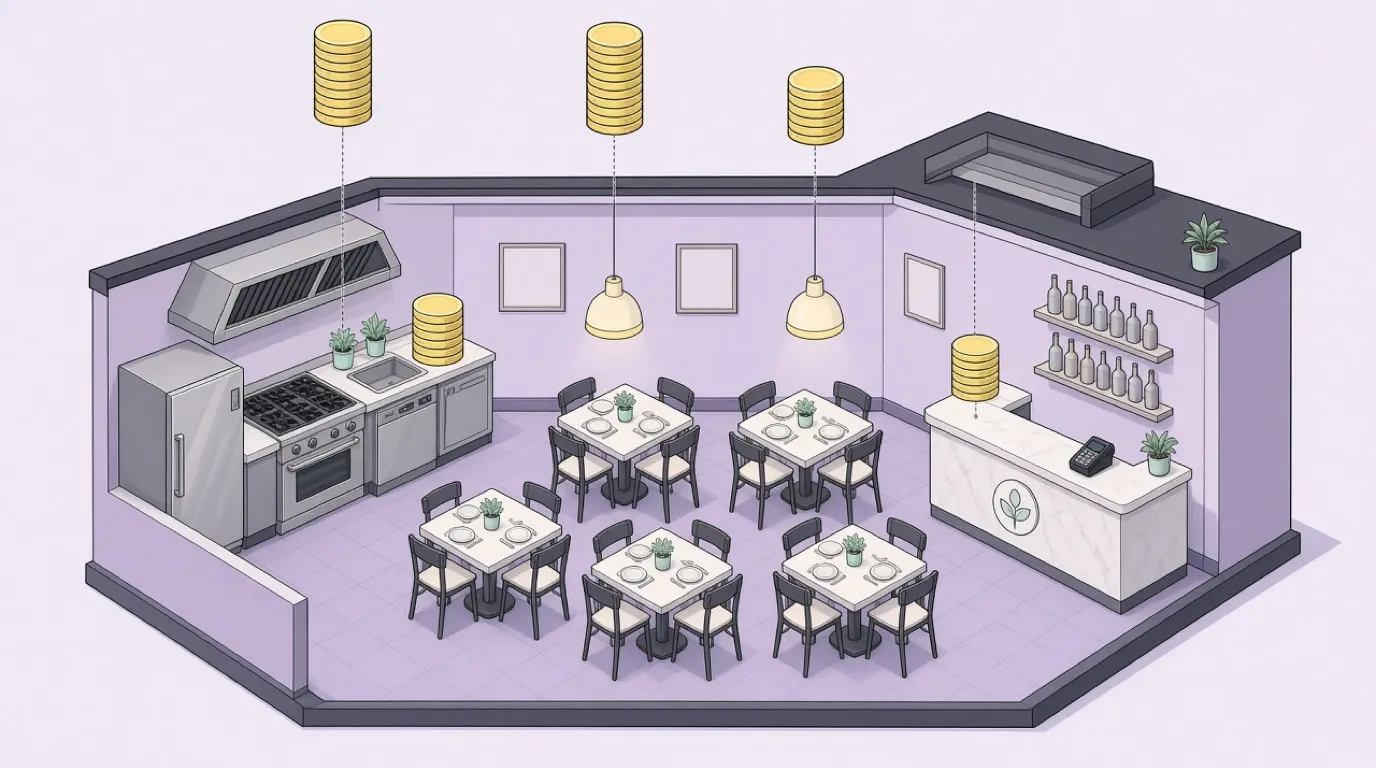
Ask an owner where the money goes and the answer is usually food and wages. That's right, and it's only two thirds of the answer. The other third is twenty or more smaller bills (energy, card fees, rent, the linen company, the accountant, the POS subscription), and those are the restaurant operating costs nobody watches until a quiet month turns them into a loss. Your restaurant accounting already holds every one of them. The trick is to see them as one list, sorted by how they behave when sales change.
That behaviour matters more than the total. Food cost falls when covers fall. Rent doesn't. Hourly wages fall only if someone changes the rota, and energy barely moves at all. Food cost is the easiest one to track day by day, because restaurant stock management can deduct ingredients as each dish sells. The fixed lines take a monthly habit instead.
Below is the full list with common shares of sales, one month at a 60-seat bistro line by line, what a 10 percent fall in sales does to its profit, and where each cost can realistically be cut. The bistro makes 5,968 in a normal month. With 10 percent fewer sales and nothing else changed, it makes 1,146.
What are restaurant operating costs?
Restaurant operating costs are all the recurring costs of running a restaurant once it is open, from ingredients and wages to rent, energy and card fees.
- Food and drink cost
- Wages and payroll taxes
- Rent and occupancy
- Energy, repairs and supplies
- Fees, software and marketing
They are the cost lines of the monthly profit and loss statement, between the sales at the top and the profit at the bottom.
Restaurant operating costs are usually tracked in one of these:
- Accounting software fed by the bank and supplier invoices
- A restaurant POS with built-in cost and margin reports
- A monthly spreadsheet kept by the owner or accountant
In short: restaurant operating costs are everything you pay, month after month, to keep the doors open and the kitchen cooking.
Operating costs vs operating expenses vs overhead
Accountants, lenders and other operators use these words loosely, and the same number can mean different things in different conversations. Agree which one you mean before comparing yours with anybody else's.
Operating costs
Every recurring cost of running the restaurant, including food, drink and labour. Used this way, operating costs plus profit equal sales.
Operating expenses
On many restaurant P&Ls, the costs below prime cost: card fees, marketing, repairs, utilities, supplies and software, sometimes called controllable expenses. Food and labour sit above them, and rent often sits in its own occupancy section.
Overhead
The costs that don't depend on how busy you are: rent, insurance, salaries, software, the accountant. Overhead is what the restaurant spends on a night with no guests at all.
Startup costs
Money spent once, before opening: the fit-out, the kitchen equipment, deposits and pre-opening wages. They belong in the opening budget, covered in our article on restaurant startup costs, and come back into operating costs only as depreciation and loan interest.
Key distinction:
- Operating costs include food and labour; on most P&Ls, operating expenses don't. A "12 percent operating expense" figure and a "92 percent operating cost" figure can describe the same month.
- Overhead is a behaviour, not a P&L section: it's the part of the costs that stays put when sales move.
The full list of restaurant operating costs
Here's the restaurant operating expenses list most independent venues work from, grouped the way a P&L groups them. The shares are common starting points for a full-service restaurant with a bar, not rules. A café runs a lower food cost, a cocktail bar a lower labour cost, and a city-centre lease can double the occupancy line.
| Cost group | What it includes | Common share of sales |
|---|---|---|
| Cost of sales | Food, drink and the packaging sold with them | 28 to 35% |
| Labour | Wages, salaries, payroll taxes, benefits, staff meals | 25 to 35% |
| Occupancy | Rent, service charge, property tax, insurance | 6 to 10% |
| Energy and water | Gas, electricity, water, waste water | 3 to 5% |
| Payment and channel fees | Card processing, delivery commissions, booking fees | 2 to 5% |
| Running costs | Repairs, cleaning, linen, smallwares, supplies | 3 to 5% |
| Admin and marketing | Software, accountant, licences, marketing | 3 to 6% |
The first two lines together are prime cost, the pair to watch first, and the targets are in our article on restaurant prime cost. The rest of the list deserves more attention than it gets, because it's where costs drift without anyone deciding they should.
Cost of sales
Everything you buy to sell: ingredients, drinks, and the boxes and cups that leave with a takeaway order. Measure it against the sales it produced, food cost against food sales and drink cost against drink sales, because the two run at very different rates. The method is in our article on food cost percentage.
Labour
Gross wages are only part of it. Payroll taxes, pension contributions, holiday pay, sick pay, staff meals and training hours all belong here, and together they commonly add 10 to 20 percent on top of the wage bill. Leave them out and labour looks several points lower than it is. Our article on restaurant labour cost covers the formula and the drivers.
Occupancy
Rent, plus everything that comes with the building: a service charge in a shopping centre, property tax or business rates, buildings and contents insurance. It's the one group you can't change month to month, which is why it's decided when the lease is signed.
Energy and water
Kitchens are energy-hungry: ovens, fryers, extraction, dishwashers, refrigeration running all night. Energy has become one of the fastest-rising lines in many markets, and it's semi-variable: a quiet Tuesday uses less gas than a busy Saturday, but the walk-in fridge costs the same either way.
Payment and channel fees
Card processing, delivery platform commissions, online booking fees and gift card platforms. Small percentages on every sale, which add up to a line the size of the energy bill. They're variable, and they're easy to stop seeing because they come out of the money before it reaches the bank.
Running costs
Repairs and maintenance, cleaning chemicals and contracts, linen hire, waste collection, pest control, smallwares (the glasses, plates and pans that break or vanish), and paper and till rolls. Each one is small. Together they're often bigger than the marketing budget.
Admin and marketing
The POS and other software subscriptions, the accountant and payroll bureau, bank charges, licences and music rights, and whatever you spend on getting guests in. Mostly fixed and mostly on contracts, which makes them the easiest lines to review once a year and the easiest to forget the rest of the time.
Fixed, variable and semi-variable restaurant costs
Sorting the list by behaviour, instead of by P&L section, tells you what happens to profit when sales change. Restaurant fixed and variable costs split three ways:
| Behaviour | Typical lines | When sales fall 10% |
|---|---|---|
| Variable | Food, drink, card fees, delivery commissions, packaging | Fall about 10% on their own |
| Semi-variable | Hourly wages, energy, repairs, cleaning, supplies | Fall only if someone acts |
| Fixed | Rent, salaries, insurance, software, depreciation, interest | Stay the same |
Hourly wages are the line that decides most months. On paper they're variable, because you can schedule fewer shifts. In reality they behave like a fixed cost until a manager changes the rota, and most rotas are written from habit, two weeks ahead, before anyone knows what the covers will be.
The split also gives you the break-even point: the sales at which the restaurant covers every cost and makes nothing. Divide the fixed and semi-variable costs by the share of each sale left after variable costs. You can run your own figures through the break-even calculator.
How to calculate your restaurant operating costs
A one-off calculation takes an afternoon. Done monthly after that, it takes less than an hour, because the lines don't change.
1. Take a full month, not a week
Use a closed month from the books, with every supplier invoice in. A week misses the monthly bills (rent, software, the accountant) and makes the costs look lower than they are. If you're seasonal, do a busy month and a quiet one.
2. Put every cost on one list
Work through the bank statement, the card statement and the supplier invoices, and give every payment a line. Add the costs that don't appear as a monthly payment: an annual insurance premium divided by twelve, payroll taxes due next month, depreciation on the equipment.
3. Express each line as a share of sales
Divide each cost by the month's net sales, after discounts and before sales tax. Percentages are what you can compare from month to month and with other restaurants; amounts aren't, because sales move.
4. Mark each line fixed, variable or semi-variable
Use the table above as a starting point, then adjust for your contracts. A delivery-heavy venue has more variable costs; a venue with a salaried brigade, fewer.
5. Compare with the common ranges and with last month
A line well outside the usual range is worth a question. A line that's three points higher than last month, with no reason anyone can name, is worth a meeting.
Here's that calculation for one restaurant: a 60-seat neighbourhood bistro with a bar, open six days a week, in a month with 72,000 of sales, 55,000 of it food and 17,000 drink. The figures carry no currency, so read them as euros, pounds or dollars.
| Line | Month | % of sales | Behaviour |
|---|---|---|---|
| Sales | 72,000 | 100.0% | |
| Food cost | 17,050 | 23.7% | Variable |
| Drink cost | 4,080 | 5.7% | Variable |
| Takeaway packaging | 500 | 0.7% | Variable |
| Cost of sales | 21,630 | 30.0% | |
| Hourly wages, kitchen and floor | 14,800 | 20.6% | Semi-variable |
| Payroll taxes and benefits on hourly wages | 2,072 | 2.9% | Semi-variable |
| Salaries, chef and manager | 7,000 | 9.7% | Fixed |
| Payroll taxes and benefits on salaries | 980 | 1.4% | Fixed |
| Labour | 24,852 | 34.5% | |
| Card processing fees | 1,150 | 1.6% | Variable |
| Delivery platform commissions | 1,000 | 1.4% | Variable |
| Energy and water | 2,900 | 4.0% | Semi-variable |
| Repairs and maintenance | 1,100 | 1.5% | Semi-variable |
| Cleaning, linen and waste collection | 850 | 1.2% | Semi-variable |
| Smallwares and supplies | 600 | 0.8% | Semi-variable |
| Marketing | 1,400 | 1.9% | Fixed |
| POS and software | 450 | 0.6% | Fixed |
| Accountant, licences and bank charges | 750 | 1.0% | Fixed |
| Operating expenses | 10,200 | 14.2% | |
| Rent | 5,900 | 8.2% | Fixed |
| Property tax or business rates | 700 | 1.0% | Fixed |
| Insurance | 450 | 0.6% | Fixed |
| Occupancy | 7,050 | 9.8% | |
| Depreciation | 1,600 | 2.2% | Fixed |
| Loan interest | 700 | 1.0% | Fixed |
| Depreciation and interest | 2,300 | 3.2% | |
| Profit before tax | 5,968 | 8.3% |
Prime cost comes to 64.6% of sales, labour to 34.5% and occupancy to 9.8%, all inside the common ranges. 21 lines of operating costs add up to 66,032, leaving 5,968 of profit before tax, 8.3% of sales. The 10,200 of operating expenses below prime cost is 14.2% of sales, 1.7 times the profit. For a single month like this, the P&L calculator sets the lines out the same way.

What a 10 percent drop in sales does to profit
Ten percent fewer sales sounds survivable. Two quiet weeks, a road closure, a wet August. Here's what it does to the bistro above.
| Line | Normal month | Sales down 10% | Sales down 10%, rota cut |
|---|---|---|---|
| Sales | 72,000 | 64,800 | 64,800 |
| Variable costs | 23,780 | 21,402 | 21,402 |
| Semi-variable costs | 22,322 | 22,322 | 20,490 |
| Fixed costs | 19,930 | 19,930 | 19,930 |
| Profit before tax | 5,968 | 1,146 | 2,978 |
With nothing else changed, sales fall by 7,200 and profit falls from 5,968 to 1,146: a 81 percent fall in profit from a 10 percent fall in sales. Only the variable costs, 33.0% of sales, shrink by themselves. The other 58.7% of sales is semi-variable or fixed, and it arrives in full every month.
Cutting the hourly rota by 10 percent, with its payroll taxes, saves 1,687, and a little care with energy saves another 145. Profit recovers to 2,978, about half the normal month. The rota is the biggest lever a manager has in a quiet month, and planning shifts from a covers forecast rather than from last month's rota is covered in our article on restaurant staff scheduling.
The break-even point makes the same point from the other side. Each sale leaves 67.0% after its variable costs, so the 42,252 of fixed and semi-variable costs needs 63,089 of sales to be covered. That's 12.4% below a normal month. A restaurant with a thin cushion like that can't afford a fixed cost it hasn't looked at in a year.
Restaurant operating costs as a percentage of sales
The mix changes with the format more than with the location. These ranges are common starting points, drawn from the shape of typical P&Ls; your accountant's figures for similar venues in your market are a better benchmark.
| Format | Cost of sales | Labour | Occupancy | Everything else |
|---|---|---|---|---|
| Full-service restaurant | 28 to 35% | 30 to 35% | 6 to 10% | 15 to 22% |
| Casual dining | 28 to 32% | 25 to 30% | 6 to 10% | 15 to 20% |
| Quick service | 25 to 32% | 22 to 28% | 6 to 10% | 15 to 22% |
| Bar | 20 to 26% | 22 to 30% | 7 to 12% | 15 to 20% |
| Café | 25 to 32% | 28 to 35% | 8 to 14% | 12 to 18% |
Read the columns together, not one at a time. A bar's low drink cost pays for its late-night staff and security. A café with a cheap menu and an expensive high street lease has very little room anywhere else. And a quick-service venue with a heavy delivery mix may see its "everything else" column grow by several points from commissions alone. What all these lines leave at the bottom is covered in our article on restaurant profit margins.
How to reduce restaurant operating costs, line by line
Cutting costs across the board, ten percent off everything, usually cuts the things guests notice. Go line by line instead, starting with the biggest and the ones that drifted.

Food and drink
Re-cost the menu at today's supplier prices, then check the dishes that sell most. Portions drift by a few grams a plate, which on a best-seller is real money over a year; our article on restaurant portion control covers the method. Track what's thrown away and why, because waste is food cost with nothing sold against it.
Labour
Build the rota from a covers forecast, not from last week's rota. Stagger start times so the kitchen and floor fill up as the service does. Look at overtime weekly, not when the payroll comes in. Cutting hours is the last step, after scheduling, not the first.
Card and delivery fees
Work out your effective rate: total fees divided by total card sales, including the monthly charges. Many restaurants pay more than they think, and the effective rate calculator does the arithmetic. For delivery, check what each platform order actually leaves you with the marketplace margin calculator, and consider separate delivery prices.
Suppliers
Get a second quote for your top twenty lines once a year, and compare delivered prices, minimum orders and payment terms, not only the price per kilo. The vendor cost comparison puts two suppliers side by side.
Energy
Switch equipment on in a sequence, not all at once at 7 am. Check the seals on fridge doors, clean the condenser coils, and turn the extraction down between services. Read the meter at close for a week: the overnight figure is the fixed part of the bill, and it's often higher than anyone expects.
The fixed lines
Once a year, put every contract on one page: software, linen, waste, pest control, insurance, the music licence, the coffee machine lease. Cancel what nobody uses and renegotiate the rest. It's a morning's work, and it saves money every month afterwards.
What to look for when you track operating costs
Whether the numbers come from an accountant's monthly report, accounting software or a spreadsheet, these are the things that make cost tracking useful rather than something that just gets filed.
1. Costs as a share of sales
Amounts alone don't say whether a month was good. Every line should show its percentage of sales, and food and drink cost should be shown against their own sales.
2. Monthly, within two weeks
A cost report that arrives six weeks after the month closes describes a restaurant that no longer exists. Ask for the month's figures by the second week of the next one.
3. Invoices in the right month
If a supplier invoice from the 28th lands in the next month, food cost looks low one month and high the next, and both months are wrong. Matching invoices to deliveries fixes it.
4. The same lines every month
Costs that move between "repairs" and "sundries" from one month to the next can't be compared. A fixed list of lines, as in a restaurant chart of accounts, keeps every month comparable.
5. Each site separately
A group report that adds two venues together hides the one that's losing money. Each site needs its own costs, then a combined view.
6. Last month and the plan side by side
A cost line means more next to last month's figure and next to the target. If you set targets for the year, the restaurant budget template holds them in the same lines.
Restaurant operating costs by venue type
The list is the same everywhere. What changes is which lines are biggest and which are hardest to control.
Full-service restaurants
Labour is usually the largest line, because a full brigade and floor team are needed however many guests come. Salaried chefs make a large part of it fixed. Watch covers per labour hour on quiet nights in full-service restaurants.
Casual dining and bistros
Lunch and dinner often behave like two businesses, with different covers, spends and staffing. Split labour and sales by daypart if you can, because a busy dinner can hide a lunch service that loses money in casual dining and bistros.
Bars and nightclubs
Drink cost is lower, but door staff, music licences, late-night wages and breakage add lines a restaurant doesn't carry. Stock losses at the bar show up as drink cost, which is why pour control matters for bars and clubs.
Takeaway and delivery
Packaging and platform commissions turn into some of the largest variable costs, after food. Price delivery separately where you can, and measure each channel's margin in a takeaway POS system.
Food trucks and cloud kitchens
Food trucks swap rent for pitch fees, fuel and generator costs. Cloud kitchens carry little front-of-house labour but high commissions, and several brands share one cost base that has to be split fairly. Both are on our page for food truck POS.
Hotels and resorts
Each outlet should carry its own costs: the restaurant, the pool bar, room service, banqueting. Shared costs such as the kitchen and energy need an agreed split, or one outlet looks profitable at the expense of another in hotel F&B.
Where Tableview fits, and where it does not
Tableview doesn't decide which costs to cut. It makes the costs visible sooner, and in the right lines, so the decisions come earlier.
Sales post from the POS to the ledger automatically, and the accounting module tracks margins and cost ratios in real time. Expenses are categorised automatically, receipts can be scanned and recurring costs such as rent and software follow templates, with P&L reports as daily, weekly and monthly summaries, consolidated across locations. Stock is deducted as each dish sells, with ingredients mapped to menu items for the real food cost per dish and waste events recorded. When a supplier raises a price, an alert arrives before the menu margin erodes, and purchase orders are generated when stock drops below par. Card payments are reconciled with the accounts automatically, with sales shown by payment method.
Eve Tsk, General Manager of A.Z Sunrise Resort & Fitness Club in Phuket, Thailand, described the multi-outlet case on our customer reviews page: "Having a restaurant and a beach bar, we didn't know how to synchronize inventory and sales. Tableview solved this with an easy and fast implementation. We were up and running in less than a week."
Where something else is the better choice:
- If your accountant already sends monthly management accounts in useful lines, within two weeks, keep that process and use the POS reports for the weekly picture.
- Energy monitoring, payroll and benefits administration are jobs for specialist tools; Tableview supplies the sales and labour context, not the meter readings or the payslips.
- A large group with a finance team and a corporate ERP will want cost reporting inside that system.
Key takeaways
- Restaurant operating costs are the recurring costs of running an open restaurant: food, drink, labour, occupancy and the running expenses in between.
- Food and labour together, prime cost, are commonly 55 to 65 percent of sales; occupancy adds 6 to 10 percent.
- Sort costs by behaviour: variable costs fall with sales, fixed costs never do, and hourly wages fall only when the rota changes.
- In the worked example, a 10 percent fall in sales takes 81 percent off monthly profit.
- Track every line as a share of sales, monthly, within two weeks of the month closing.
- Cut line by line, starting with the rota, supplier prices and fees, and review every fixed contract once a year.
Read next: restaurant cash flow management for when the money actually leaves, the restaurant P&L statement for reading the report these costs sit in, and restaurant break-even analysis for the formula behind the quiet month.